I’ve tested every major STR analytics platform on the market. Here’s which ones are actually worth paying for, and which free alternatives give you 80% of the data.
When I first started doing rental arbitrage, I wasted hundreds of dollars on analytics tools I didn’t need. Some were overkill for my business model. Others gave me data I could’ve found for free. And a few? They were genuinely worth every penny.
The short-term rental analytics space has exploded. AirDNA, Rabbu, Mashvisor, PriceLabs, AllTheRooms, everyone’s fighting for your monthly subscription. But here’s what nobody tells you: the best tool depends entirely on whether you’re buying investment properties or doing arbitrage. Those are fundamentally different business models with completely different data needs.
This guide breaks down every major Airbnb analytics tool available in 2026. I’ll cover what each one actually does well, where it falls short, what it costs, and, most importantly, which one you should pick based on your specific situation. I’ve also included free alternatives that’ll get most beginners 80% of the way there without spending a dime. Plus, I’ll share the exact workflow we use at 10XBNB to analyze markets, the same process our students use to evaluate deals and launch profitable Airbnb businesses.
Why You Need Airbnb Analytics Tools (And When You Don’t)
Let me be blunt: most new hosts don’t need a paid analytics tool on day one.
That’s a controversial take in an industry where every guru pushes AirDNA subscriptions on day one. But it’s true. If you’re analyzing your first market and you haven’t committed to a strategy yet, free tools and manual research will tell you what you need to know.
What Data Actually Matters for Decision-Making
Not all STR data is created equal. Here’s what actually moves the needle when you’re evaluating a market or a deal:
- Average Daily Rate (ADR) – What comparable properties charge per night
- Occupancy Rate – How often those properties are booked (and seasonal variation)
- Revenue per Available Night (RevPAN) – ADR multiplied by occupancy. The single most important metric
- Comparable property performance – What similar-sized listings in the same submarket actually earn
- Seasonal patterns – When demand peaks and valleys hit, and by how much
- Supply trends – Whether the market is getting saturated or still has room
Everything else, the fancy heatmaps, the neighborhood scoring algorithms, the proprietary “investment grade” ratings, is nice to have. But those six data points drive 90% of smart decisions.
When Free Tools Are Enough vs When to Pay
Here’s my general rule:
Free tools are enough when:
- You’re exploring your first 1-3 markets
- You’re doing rental arbitrage (not buying property)
- Your budget is tight and you need every dollar for startup costs
- You just need a quick sanity check on a specific deal
Paid tools become worth it when:
- You’re analyzing 5+ markets simultaneously
- You’re making a purchase decision on a $300K+ property
- You’re a multi-property operator needing ongoing market intelligence
- Time is more valuable than the subscription cost (you’re scaling fast)
The Difference Between Buying Analysis and Arbitrage Analysis
This distinction is massive and almost nobody talks about it.
If you’re buying an investment property, you need deep market data: cap rates, property appreciation trends, long-term rental comparisons, mortgage scenarios, and exit strategy modeling. Tools like AirDNA and Mashvisor are built for this.
If you’re doing rental arbitrage, your analysis is completely different. You need rent-to-revenue ratios, lease negotiation data, comparable Airbnb revenue in specific neighborhoods, and a way to quickly validate deals before signing a lease. Most analytics tools are built for investors, not arbitrage operators.
That’s why I always tell our students at 10XBNB to start with free research methods and a solid rental arbitrage spreadsheet before dropping money on subscriptions. The spreadsheet method forces you to actually understand the numbers instead of blindly trusting an algorithm.
Best Paid Airbnb Analytics Tools (Ranked)
I’ve personally used or tested every tool on this list. Here’s my honest ranking for 2026, with specific use cases for each.
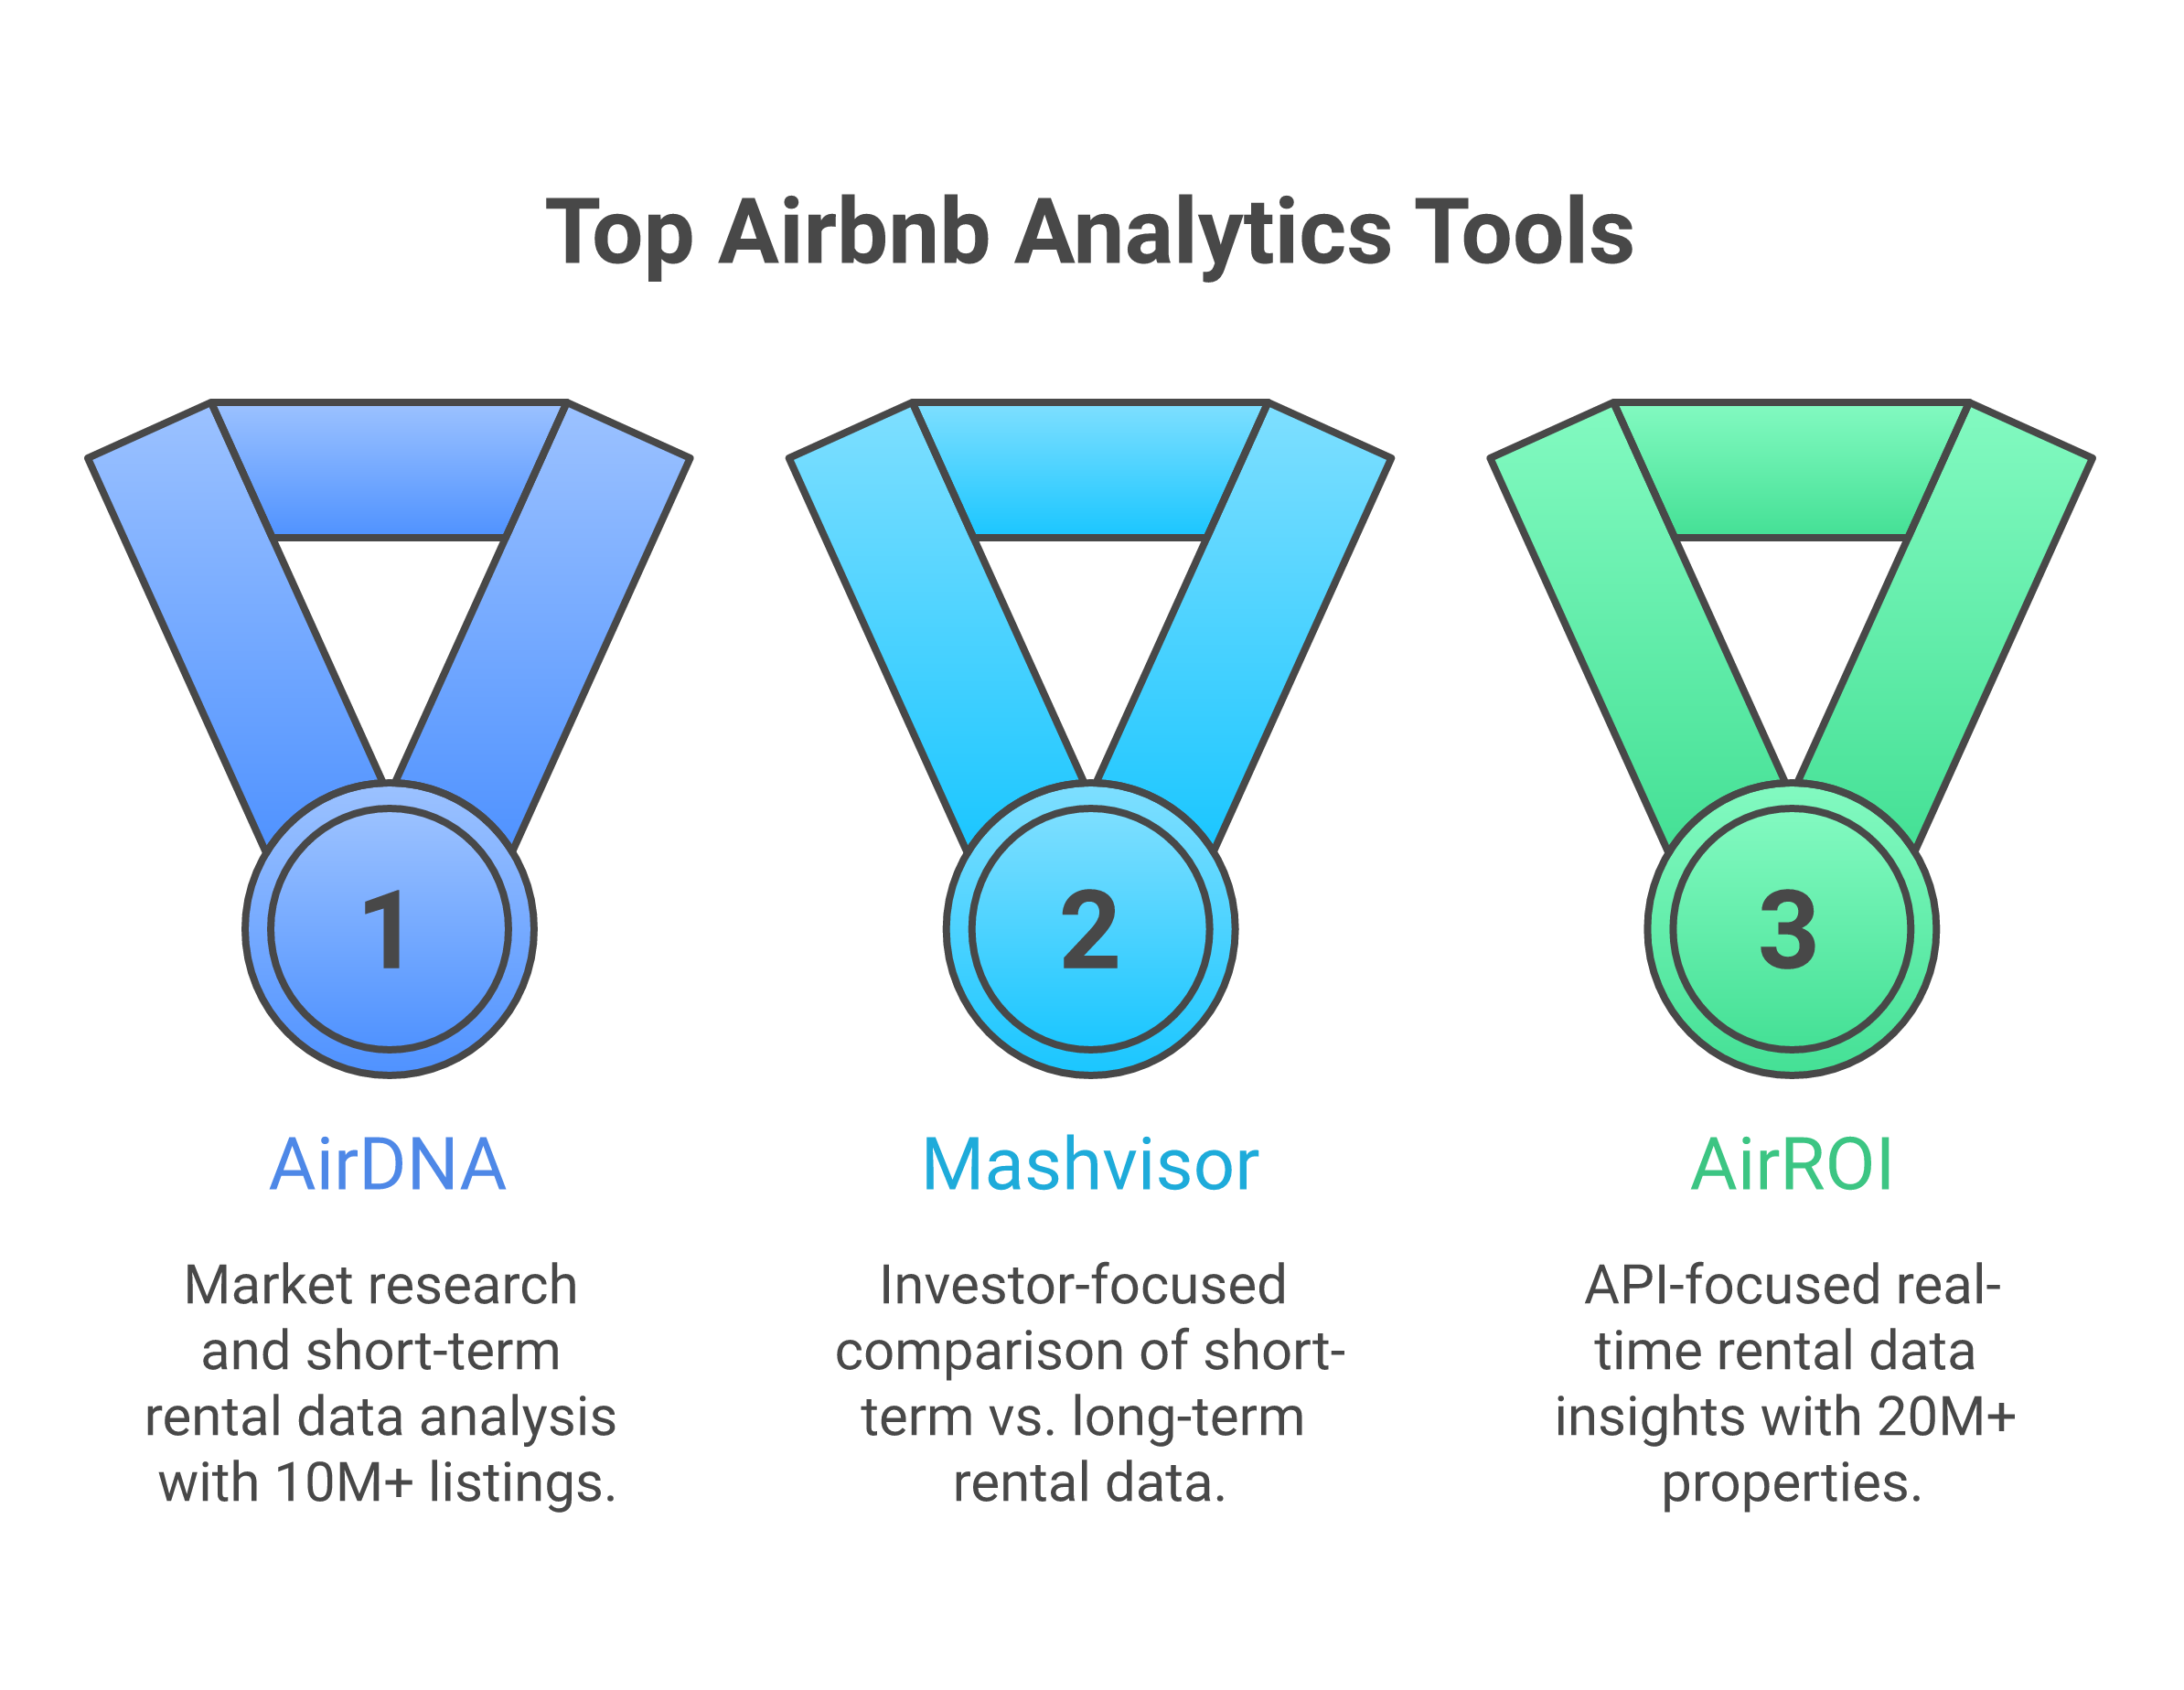
1. AirDNA, Best Overall for Market Data
AirDNA has been the industry standard for STR analytics since 2015, and there’s a good reason it’s still on top. They track performance data for over 10 million Airbnb and Vrbo listings worldwide. That dataset is hard to compete with.
What it does:
AirDNA’s core product, MarketMinder, gives you detailed market-level analytics including RevPAR (Revenue Per Available Room), occupancy rates, ADR trends, seasonal demand patterns, and supply growth. Their Rentalizer tool lets you plug in any property address and get an estimated revenue projection based on comparable listings.
They also offer investment-grade scoring, competitive analysis tools, and forward-looking demand data. The platform recently added AI-driven insights and customizable dashboards that let you compare markets side by side.
Pricing:
AirDNA restructured their pricing in 2025. The free tier gives you limited city-level snapshots. The paid MarketMinder plans start at around $12/month for a single neighborhood and scale up based on market size and coverage area. If you want multiple markets or advanced features, you’re looking at $30-60/month. Enterprise plans for property managers and investment firms are custom-quoted.
Pros:
- Largest and most accurate STR dataset globally
- 10+ years of historical data for trend analysis
- Rentalizer gives quick property-level revenue estimates
- Clean, intuitive interface that’s improved significantly
- Forward-looking occupancy and revenue forecasts
- Widely recognized in the industry, lenders and partners trust AirDNA numbers
Cons:
- Pricing adds up fast if you’re tracking multiple markets
- Rentalizer estimates can be off by 15-25% in less popular markets
- Investment-focused. Not built for arbitrage operators
- Free tier is too limited to be genuinely useful
- Data is less reliable in rural or low-supply markets
Best for: Serious investors analyzing purchase opportunities, multi-property operators needing ongoing market intelligence, and anyone making six-figure property acquisition decisions.
My take: AirDNA is the gold standard. If you’re buying an investment property, you probably need it. If you’re doing arbitrage, you probably don’t, at least not at first. The data is excellent, but you can get 70% of it through manual research and free tools until you’re scaling past 3-4 units.
2. Rabbu, Best Free Market Analysis Tool
Rabbu has carved out an interesting niche. They’re primarily a marketplace for buying and selling short-term rental properties, but their free analytics tools are genuinely useful, and that’s what landed them on this list.
What it does:
Rabbu’s free Airbnb Calculator generates income projections for any property address in the US. Plug in an address and you get month-by-month revenue estimates, ADR, occupancy rates, RevPAN, and a list of comparable properties. Their Market Finder tool identifies high-performing STR markets nationwide using occupancy, ADR, and gross yield data. They also offer a proprietary ROI scoring system for investment analysis.
Pricing:
The core calculator and market data tools are free. Rabbu monetizes through their STR marketplace (buying/selling properties) and management services, which means their analytics tools serve as lead generation, and that’s actually good news for you. You get solid data without paying for it.
Pros:
- Genuinely free with no paywalled bait-and-switch
- Property-level revenue projections with seasonal breakdowns
- Decent comparable property analysis
- Clean interface, fast results
- Market-level data for every US market
- Expense calculator built in (mortgage, cleaning, management fees)
Cons:
- Smaller dataset than AirDNA, less reliable in niche or low-supply markets
- Focused on investment/buying analysis, not arbitrage metrics
- No dynamic pricing integration or operational tools
- US-only coverage (no international data)
- Revenue estimates can skew optimistic in some markets
- Limited historical data compared to AirDNA’s decade-plus archive
Best for: Investors doing initial market research before committing to a paid AirDNA subscription. Also great for quick property-level revenue estimates when you need a second opinion alongside other data sources.
My take: Rabbu deserves credit for offering genuinely useful free tools. Most “free” analytics platforms give you barely enough to justify a screenshot. Rabbu’s calculator actually provides actionable data. That said, the dataset is smaller than AirDNA’s, and if you’re doing arbitrage in specific cities, you’ll need to supplement with manual research. I use Rabbu as a quick second opinion when cross-referencing AirDNA numbers, and for that purpose, it’s excellent.
3. Mashvisor, Best for Investment Property Analysis
Mashvisor is built specifically for real estate investors who are deciding between traditional long-term rentals and short-term Airbnb strategies. If that’s your decision, Mashvisor might be the most useful tool on this list.
What it does:
Mashvisor provides property-level ROI analysis that compares long-term rental income against potential Airbnb income for the same property. Their heatmap tool visualizes profitability by neighborhood. The platform pulls from MLS data, Zillow, Rentometer, Airbnb, and Census Bureau sources to give you a blended view of any market’s investment potential.
They’ve also added dynamic pricing tools, a property finder with investment scoring, and foreclosure/multifamily data on higher-tier plans.
Pricing:
Mashvisor’s quarterly plans run $29.99/month (Lite), $99.99/month (Standard), and $119.99/month (Professional). They also offer vacation rental management plans starting at $13/month. Annual billing gets discounts. They run frequent promotions, I’ve seen 30-50% off during holiday sales.
Pros:
- Side-by-side traditional vs. Airbnb rental comparison (unique feature)
- Heatmap visualization of profitable neighborhoods
- Multiple data sources (MLS, Zillow, Airbnb, Census)
- Property finder with investment-grade scoring
- Good for comparing buy-and-hold vs. STR strategies
Cons:
- Accuracy varies by market, better in major metros, weaker in secondary markets
- Expensive for what you get (the Standard plan at $100/month is steep)
- Not useful for arbitrage operators at all
- Interface feels cluttered compared to AirDNA
- Airbnb-specific data isn’t as deep as dedicated STR tools
Best for: Real estate investors weighing traditional rental vs. Airbnb strategy, and anyone using the “house hack” approach where you need to compare both income streams.
My take: Mashvisor solves a specific problem really well: “Should I rent this property long-term or do Airbnb?” If that’s your question, it’s the best tool for the job. But if you’ve already committed to STR, you’ll outgrow Mashvisor quickly. And at $100/month for the Standard plan, it’s hard to justify unless you’re actively shopping for investment properties.
4. AllTheRooms, Best for Large-Scale Data
AllTheRooms plays in a different league than the other tools on this list. While AirDNA and Rabbu target individual investors and hosts, AllTheRooms focuses on enterprise clients, tourism boards, government agencies, large property management companies, and real estate development firms.
What it does:
AllTheRooms tracks STR data from Airbnb, Vrbo, Booking.com, and other platforms. Their analytics cover occupancy, ADR, RevPAR, supply trends, and competitive benchmarking. They offer interactive dashboards with global and local filtering, forward-looking occupancy forecasting, and destination intelligence for DMOs and municipalities.
In 2025, AllTheRooms merged with Deckard Technologies to expand into the GovTech space, adding regulatory compliance and permit tracking features.
Pricing:
The Basic plan starts at $19/month and the Pro plan is $49/month. Enterprise pricing is custom-quoted and can run into thousands per month depending on data scope and geographic coverage. Individual market access is relatively affordable, but the real power (and cost) is in their enterprise dashboards.
Pros:
- Multi-platform data (not just Airbnb)
- Strong global coverage
- Forward-looking demand forecasting
- Good export options (Excel, PDF)
- Useful for understanding regulatory landscape in a market
Cons:
- Enterprise focus means individual investors are an afterthought
- The affordable plans have limited data depth
- Not intuitive for non-technical users
- Overlap with AirDNA at the individual level without matching its depth
Best for: Property management companies with 50+ units, tourism boards, municipal governments tracking STR impact, and real estate developers evaluating markets for new builds.
My take: Unless you’re managing a large portfolio or working in a government/tourism capacity, AllTheRooms probably isn’t for you. The entry-level plans are affordable but thin. The real value is in their enterprise product, which is priced for organizations with big budgets. For individual investors and arbitrage operators, your money is better spent elsewhere.
5. PriceLabs Market Dashboard, Best Free Add-On for Active Hosts
PriceLabs is primarily known as a dynamic pricing tool, but their Market Dashboard feature has quietly become one of the best market analysis tools available, especially because it’s essentially a free bonus for existing subscribers.
What it does:
The Market Dashboard provides market-level analytics including ADR, occupancy, RevPAR, booking lead times, and competitive benchmarking. PriceLabs collects data daily from Airbnb and Vrbo, and their pre-built dashboards cover 200+ STR markets across the US and Europe. You can also create custom dashboards for specific submarkets or comp sets.
The real magic is integration with their dynamic pricing engine. Your market research directly informs your pricing strategy within the same platform.
Pricing:
Market Dashboards start at $9.99/month per dashboard. But here’s the thing, if you’re already using PriceLabs for dynamic pricing (which starts at about $20/month per listing), the Market Dashboard is a natural extension. Many hosts effectively get market analytics as part of their existing pricing subscription. New users get a 30-day free trial.
Pros:
- Two tools in one, pricing and market research on the same platform
- Daily data updates (most competitors update weekly or monthly)
- Customizable comp sets that feed directly into your pricing rules
- Pre-built dashboards for 200+ markets
- Export capabilities (PDF, CSV)
- Affordable standalone price
Cons:
- Less depth than AirDNA for pure market analysis
- Primarily useful if you’re already on PriceLabs for pricing
- No investment analysis or ROI calculators
- Not designed for pre-purchase market evaluation
Best for: Active hosts and property managers already using PriceLabs for dynamic pricing who want market intelligence without subscribing to a separate analytics platform. Also great for optimizing your pricing strategy with data rather than gut feel.
My take: PriceLabs is the tool I actually use most in my day-to-day operations. Not because the market analytics are the deepest, they’re not, but because having pricing and market data in one platform eliminates friction. When I see occupancy trending down in my market dashboard, I adjust pricing rules in the same interface. That integration is worth more than any standalone analytics product for active operators.
Best Free Airbnb Analytics Alternatives
You don’t need to spend a dollar to do solid market research. Here are the free methods I still use, even with paid subscriptions.
Airbnb Search (Manual Comp Analysis)
This is the most underrated research method in the industry. Everyone wants a fancy dashboard. But searching Airbnb like a guest teaches you things no analytics tool ever will.
Here’s my step-by-step process for analyzing any market for free:
- Search Airbnb for your target market – Set dates 2-3 months out, filter by property type (entire place, 2BR, etc.), and sort by relevance
- Count the first 50 results – Note the price range. The middle 60% is your realistic ADR window
- Click on 10-15 listings similar to what you’d operate – Look at their calendar availability. If a listing is mostly booked 2-3 months out, that’s a healthy sign. Wide open calendars = trouble
- Check review counts and recency – A listing with 200+ reviews and recent bookings is a proven performer. A listing with 5 reviews in 2 years is not your comp
- Screenshot pricing for different dates – Check weekday vs. Weekend rates, holiday pricing, and off-season rates. This gives you seasonal variation data that rivals what AirDNA shows
- Look at the “Similar listings” section – Airbnb’s algorithm shows you your true competitors. These are the comps that matter
- Note amenity patterns – What do top performers have? Hot tubs? Game rooms? Pet-friendly policies? This is competitive intelligence you won’t find in any analytics dashboard
This process takes about 30-45 minutes per market. Do it for 3-5 markets and you’ll have a better gut feel for the STR landscape than someone who spent $50/month staring at graphs.
Zillow + Apartments.com (Rental Rate Research)
For arbitrage operators, knowing the rent is just as critical as knowing the Airbnb revenue. Your profit is the gap between what you pay a landlord and what guests pay you.
How to use these for free:
- Zillow Rental Manager – Search for current rental listings in your target market. Filter by bedrooms and property type. The listing prices give you real-time market rent data. More accurate than any estimated rent tool because these are actual asking prices.
- Apartments.com – Similar to Zillow but often has listings Zillow doesn’t. Cross-reference both for a complete picture.
- Facebook Marketplace Rentals – Many landlords post directly to Facebook. These listings often have lower rents than those on professional platforms, which is exactly what arbitrage operators want.
The formula is simple: if a 2BR apartment rents for $1,500/month and comparable Airbnb listings in the area earn $3,500-4,500/month, you have a potential deal. That rental arbitrage spreadsheet I mentioned earlier? This is exactly the kind of data you plug into it.
Google Trends + Census Data (Market Demand Analysis)
Want to know if a market is growing or dying? Two free tools give you that answer.
Google Trends:
Search for “[City name] Airbnb” or “[City name] vacation rental” and look at the 5-year trend. Rising interest = growing demand. Flat or declining = market saturation or regulatory headwinds. Compare your target market against 3-4 others to see relative demand.
Census Bureau Data (data.census.gov):
Gives you population growth, median household income, employment trends, and tourism statistics. Markets with strong population growth and rising incomes tend to have healthier STR markets. This macro data helps you avoid investing in declining areas, something no STR-specific analytics tool tells you.
STR regulation databases:
Before you analyze a single number, check if the city even allows short-term rentals. Websites like Airbnb’s own “Responsible Hosting” pages, local government sites, and community forums will tell you about permit requirements, occupancy limits, and outright bans. I’ve seen people buy AirDNA subscriptions for markets where STRs are illegal. Don’t be that person.
AirDNA Free Tier (Limited but Useful)
AirDNA does offer a free account that gives you basic city-level snapshots. Here’s what you actually get without paying:
- City-level overview (average ADR, occupancy, revenue)
- Top-performing neighborhood highlights
- Limited Rentalizer searches (estimate revenue for specific addresses)
- Basic seasonal demand charts
What you don’t get: detailed comp analysis, historical trends, custom market reports, neighborhood-level data, or download capabilities.
Is it useful? Honestly, barely. The free tier feels like a teaser designed to get you to subscribe. You’ll get more actionable data from 30 minutes of manual Airbnb searching than from the free AirDNA snapshot. But it’s worth the 5 minutes to create an account and check, sometimes the city overview alone confirms or eliminates a market from your list.
Which Tool Is Right for You? (Decision Matrix)
Here’s the comparison table I wish someone had given me when I started:
| Tool | Monthly Cost | Best For | Data Depth | Arbitrage Useful? | Investment Useful? |
|---|---|---|---|---|---|
| AirDNA | $12-60+ | Overall market research | Excellent | Somewhat | Excellent |
| Rabbu | Free | Quick revenue estimates | Good | Limited | Good |
| Mashvisor | $30-120 | LTR vs STR comparison | Good | No | Excellent |
| AllTheRooms | $19-49+ | Enterprise/large portfolios | Good | No | Good |
| PriceLabs | $10-20+ | Active host market intel | Good | Yes | Limited |
| Airbnb Search | Free | Manual comp analysis | Medium | Excellent | Good |
| Zillow/Apts.com | Free | Rental rate research | Good | Essential | Essential |
| Google Trends | Free | Market demand trends | Basic | Useful | Useful |
My Recommendation by Business Model
Arbitrage operators (just starting):
Start with free tools. Airbnb manual search + Zillow for rent data + a solid arbitrage spreadsheet. That’s all you need for your first 1-3 deals. Save your subscription dollars for actual startup costs – furniture, supplies, and your first month’s rent.
Arbitrage operators (scaling):
PriceLabs Market Dashboard + manual research. Once you’re managing 3+ units, the dynamic pricing alone pays for itself. The market dashboard becomes your competitive intelligence layer. Use Rabbu’s free calculator for quick property estimates when evaluating new deals.
Property investors (pre-purchase):
AirDNA is worth it. Period. When you’re making a $200K-500K purchase decision, a $30-60/month subscription that gives you accurate revenue projections is the cheapest insurance policy imaginable. Cross-reference with Rabbu’s free calculator for a second opinion.
Investors choosing between LTR and STR strategy:
Mashvisor was literally built for this comparison. Use it during your evaluation phase, then cancel once you’ve committed to a strategy.
Large-scale operators (10+ properties):
AirDNA for market intelligence + PriceLabs for pricing optimization. Consider AllTheRooms if you need multi-platform data or regulatory compliance tracking. At this scale, data subscriptions are a rounding error in your operating budget.
Beginners who aren’t sure yet:
Don’t buy anything. Seriously. Use Rabbu’s free calculator, do manual Airbnb research, check Zillow for rent data, and read our guide on how to start an Airbnb business. You’ll know when you need paid tools. It’s the moment free research starts costing you more time than the subscription would save.
How We Use Analytics at 10XBNB
I’ll share our actual workflow, because theory is useless without seeing how it applies in practice.
Our Market Selection Process
When we’re evaluating a new market, or teaching students to evaluate the best Airbnb markets in 2026 – here’s our actual process:
- Google Trends screen (2 minutes) – Is demand for STR in this market growing, stable, or declining? Declining markets get eliminated immediately, regardless of what the revenue numbers look like right now.
- Regulation check (5 minutes) – Is the market STR-friendly? Any pending legislation? Markets with hostile or uncertain regulatory environments get deprioritized.
- Rabbu quick screen (5 minutes) – Plug 3-5 representative addresses into Rabbu’s free calculator. Do the revenue projections make sense? Are they consistent with each other? If Rabbu says a 2BR in the market earns $3,000/month, that’s a data point. Not gospel.
- Airbnb manual research (30 minutes) – This is where the real intelligence comes from. I search Airbnb as a guest, filter for our target property type, and analyze 10-15 comparable listings. Calendar availability, review velocity, pricing patterns, amenity standards. No tool replaces this.
- AirDNA deep dive (15 minutes, if paying) – For markets that pass the first four screens, we pull AirDNA data for historical trends, seasonal patterns, and supply growth. This is the validation layer, not the discovery layer.
- Rent analysis (10 minutes) – Zillow and Apartments.com for current rental listings. We need to know the spread between rent and potential Airbnb revenue. If the spread isn’t at least 2x, the arbitrage math doesn’t work.
- Spreadsheet modeling (15 minutes) – All of this data goes into our deal analysis spreadsheet. Revenue projections, rent, utilities, furnishing costs, cleaning fees, vacancy rates, and net profit scenarios.
Total time: about 90 minutes per market. Total cost: $0 for the first five steps (using free tools), plus whatever your AirDNA subscription costs if you use step 5.
Our Ongoing Operations Stack
Once we’re operating in a market, the tools shift from research to optimization:
- PriceLabs – Dynamic pricing across all units. Market Dashboard for competitive monitoring. This is the one paid tool every active host should seriously consider.
- Airbnb Host Dashboard – Native analytics for individual listing performance. Underrated and free.
- Manual comp checks – Monthly Airbnb searches to see if new competition has entered the market and how our positioning compares.
- Google Search Console + Analytics – For our direct booking traffic (not relevant for everyone, but critical for operators building their own brand).
What We Teach Students
Here’s what I tell every new student who asks about analytics tools:
“Don’t let tool paralysis stop you from taking action. You can analyze a market in 90 minutes with zero paid tools. The best analytics tool is a signed lease with good numbers. Stop researching and start calling landlords.”
That’s not anti-analytics. It’s anti-procrastination. I’ve seen people spend three months and $500+ on tool subscriptions, analyzing markets from every possible angle, and never actually start. The data is supposed to reduce your risk and speed up your decision-making. If it’s doing the opposite, you’re using it wrong.
Common Mistakes People Make With STR Analytics Tools
Before we wrap up, let me save you from the mistakes I see constantly, mistakes I’ve made myself.
Mistake #1: Trusting a Single Data Source
Every analytics tool has blind spots. AirDNA’s estimates can be off in low-supply markets. Rabbu’s projections sometimes skew optimistic. Mashvisor’s data varies wildly between metros and secondary markets. If you make a $300,000 investment decision based on one tool’s projection, you’re gambling. Always cross-reference at least two sources, and always, always – validate with manual Airbnb research. The 30 minutes you spend scrolling through actual listings will catch errors that no dashboard will show you.
Mistake #2: Paying for Tools Before You Have a Strategy
I can’t tell you how many people subscribe to AirDNA, Mashvisor, and three other tools simultaneously, before they’ve even decided if they’re buying property or doing arbitrage. That’s $200+/month in subscriptions generating zero revenue. Decide your business model first. Then pick the one tool that matches your model. You can always add more later.
Mistake #3: Confusing Data With Decisions
Analytics tools give you data. They don’t make decisions for you. I’ve watched aspiring hosts spend months perfecting their spreadsheet models, tweaking projections by $50/month, running scenario after scenario, and never actually launching. At some point, the data is good enough. The difference between a $3,200/month projection and a $3,400/month projection doesn’t change whether the deal is worth doing. Get the directional data right, then move.
Mistake #4: Ignoring Seasonal Variation
Annual average revenue numbers are misleading. A market that averages $3,000/month might actually earn $5,000/month in summer and $1,200/month in winter. If your rent is $1,800/month, that winter dip means you’re bleeding cash for four months straight. Always look at monthly or seasonal breakdowns. Not just annual averages. This is one area where paid tools genuinely outperform free research, because they visualize seasonality clearly.
Mistake #5: Not Accounting for Your Specific Property Type
Market-level data tells you how the average listing performs. But your property isn’t average. A well-designed 2BR with a hot tub in a walkable neighborhood will outperform market averages significantly. A dated 3BR on a busy road will underperform. Analytics tools give you baselines, not predictions for your specific property. The final 20% of your analysis needs to account for your property’s unique characteristics, and that’s something only manual comp research can do well.
Understanding Short Term Rental Data: What the Numbers Actually Tell Hosts
Before you invest in any Airbnb analytics tool, you need to understand what short term rental data actually means and how to use it to make money. Too many hosts look at Airbnb market data and draw the wrong conclusions because they don’t know which short term rental data points matter and which ones are noise.
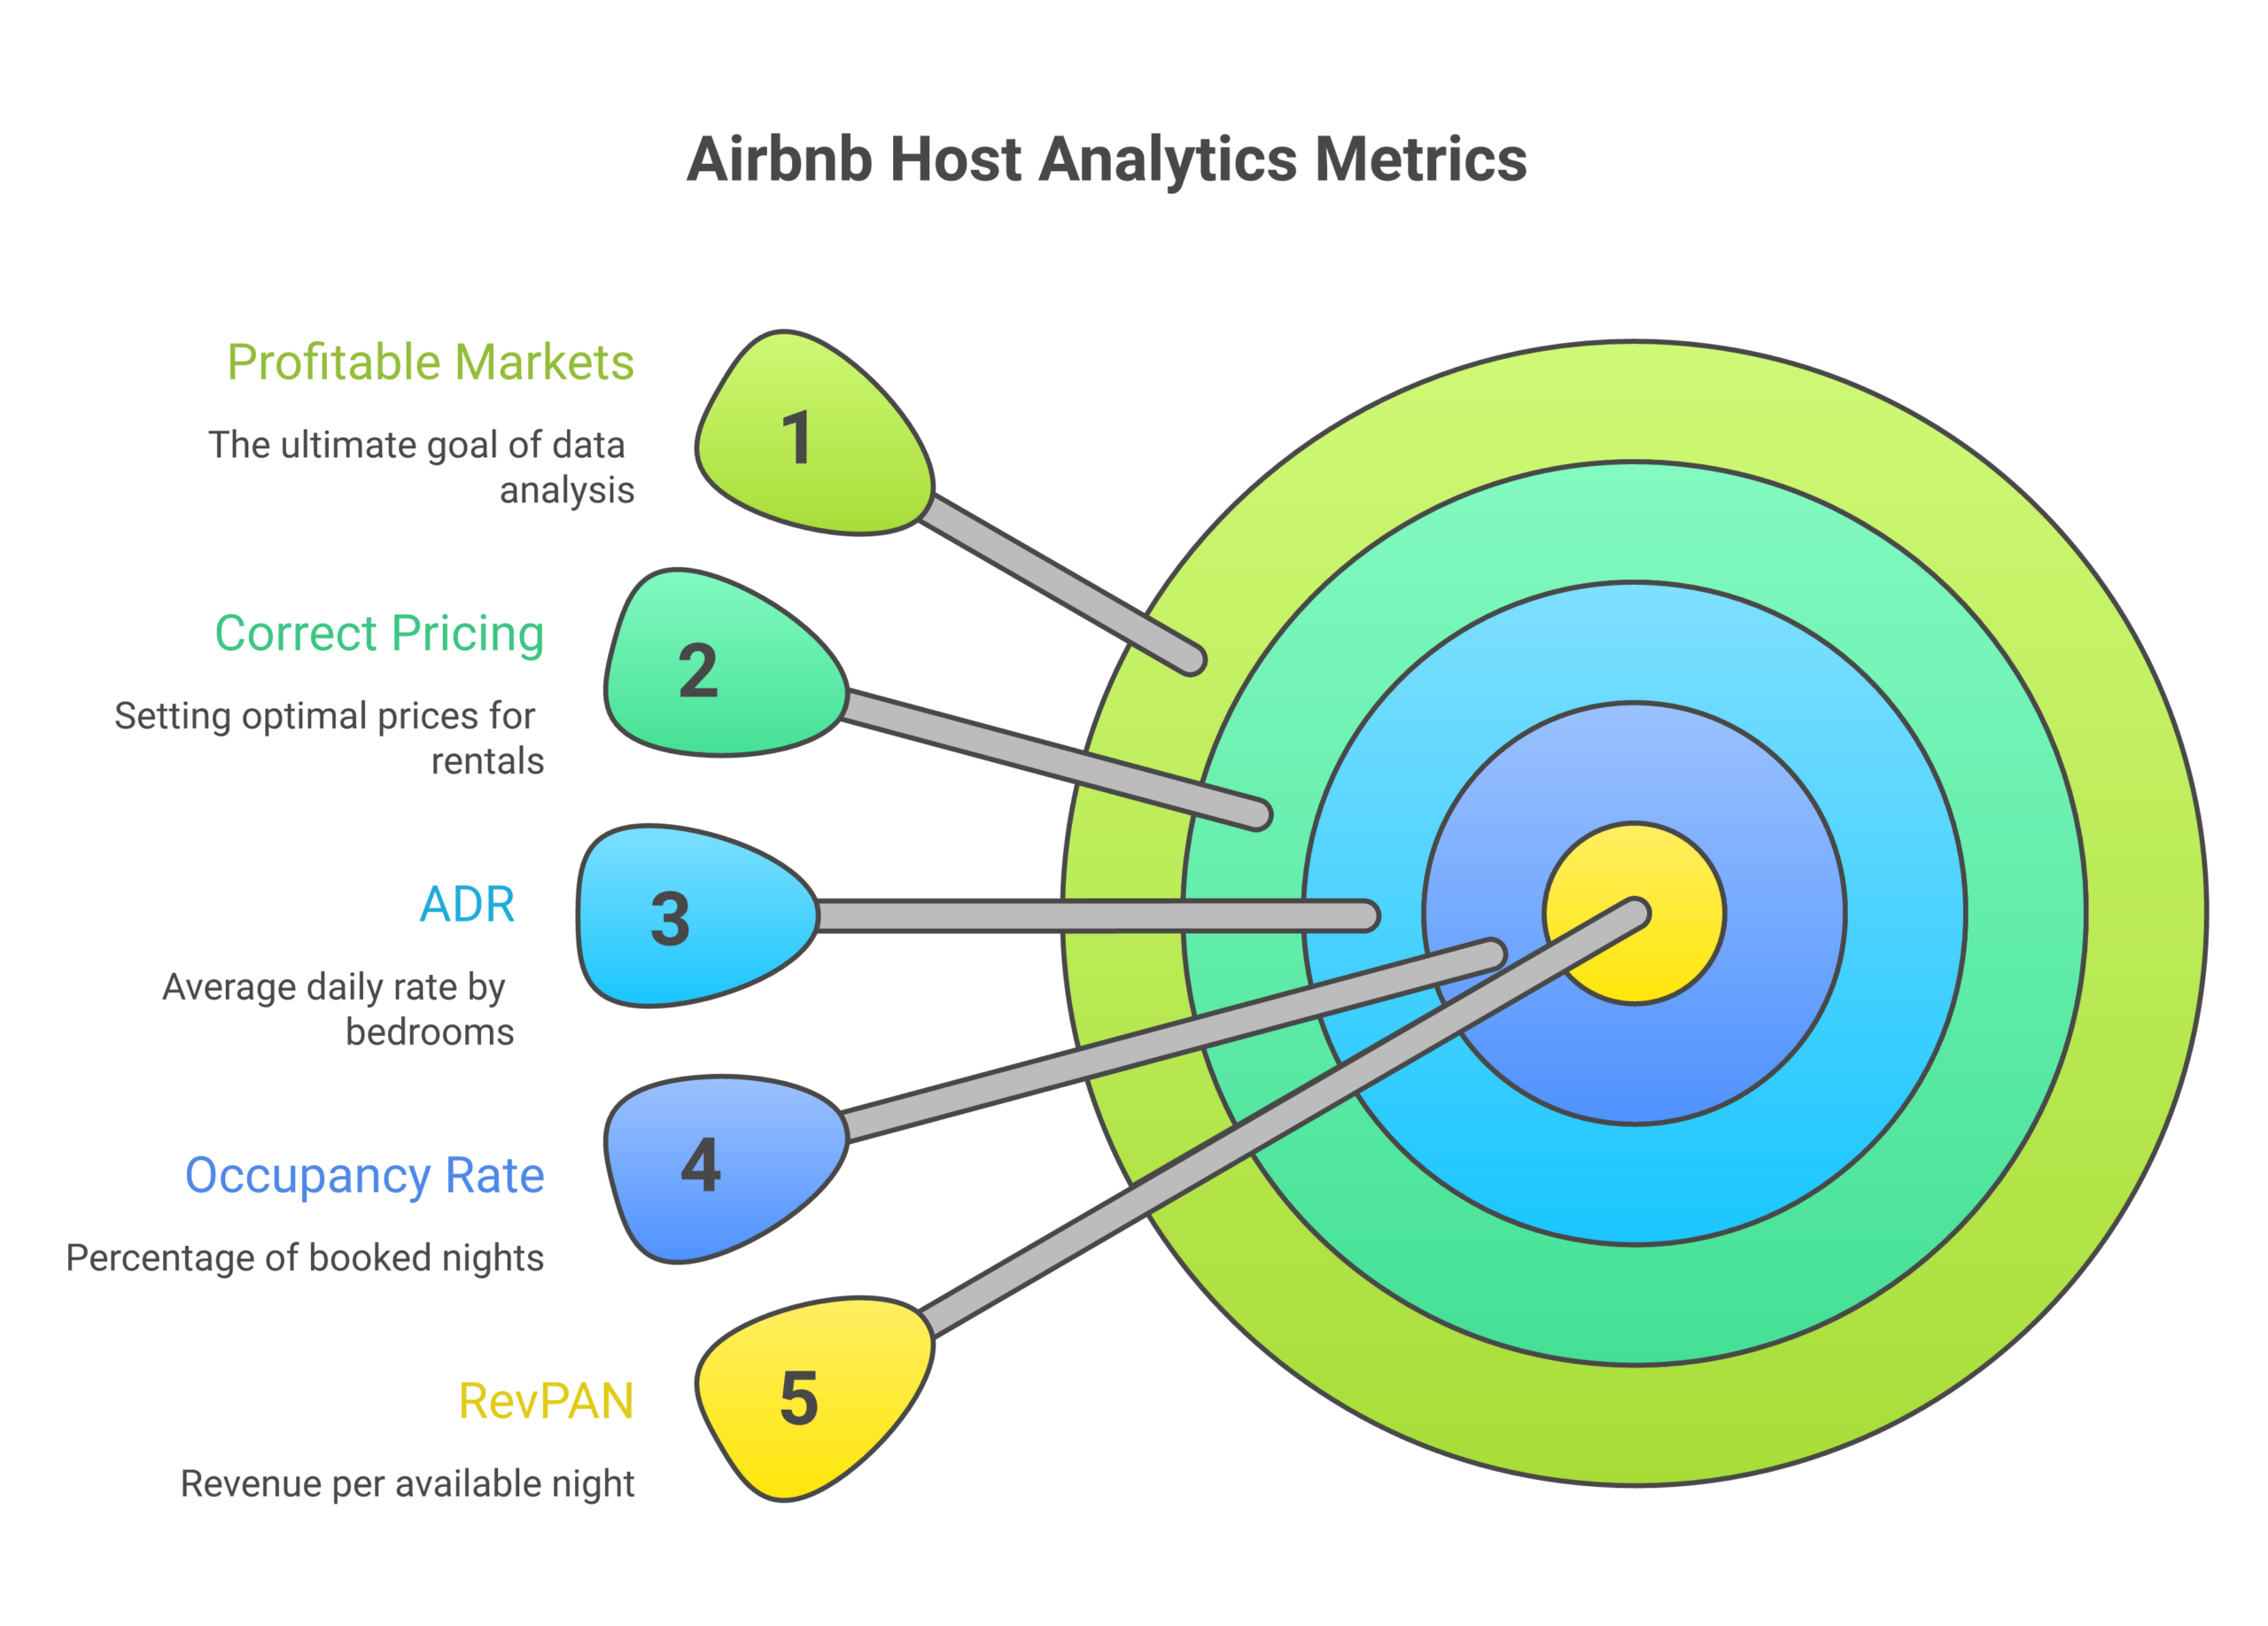
Here’s what I look at when I analyze short term rental data for any market or property:
Average daily rate (ADR) by bedroom count. The nightly rate for a 1-bedroom is completely different from a 3-bedroom in the same market. When you pull short term rental data from AirDNA or Mashvisor, always filter by the number of bedrooms that match your target property. A market might show a $200 ADR overall, but 1-bedroom listings average $130 while 3-bedroom properties with more bedrooms pull $280. That distinction in the rental data changes your entire investment calculation.
Occupancy rate trends, not just snapshots. A single month of short term rental data is meaningless. You need at least 12 months of rental data to discover seasonal patterns, identify slow months, and understand the occupancy floor (the worst month) versus the ceiling (peak season). The best Airbnb analytics tools show trailing 12-month short term rental data so hosts can discover these patterns before signing a lease or making an investment.
Revenue per available night (RevPAN). This is the most important number in short term rental data because it combines ADR and occupancy into a single metric. A property earning $300 per night at 40% occupancy ($120 RevPAN) makes less than a property earning $180 per night at 75% occupancy ($135 RevPAN). RevPAN in your rental data tells you the real earning power of a property, not just the sticker price. Smart hosts and investors use RevPAN from their analytics tools to discover which markets and property types generate the best returns.
Supply growth rate from market data. How many new short term rental listings are being added in your target market? If supply is growing faster than demand, occupancy rates will drop and your rental data projections become unreliable. AirDNA’s market data tracks supply growth at the city and neighborhood level so hosts can discover whether a market is being oversaturated before they invest in short term rentals there.
Comp set analysis. Your rental data is only useful when compared to similar properties. The best Airbnb analytics tools let you filter short term rental data by property type, number of bedrooms, amenities, and exact location. This comp set from your analytics tool helps hosts discover what similar properties are actually earning – not what the broad market average says. I use comp data from AirDNA to price every one of my 24 properties and to help 10XBNB students discover the right nightly rate for their specific short term rental listings.
Airbnb Data API: When You Need Programmatic Access to Short Term Rental Data
For hosts managing 10+ properties or building tech products in the short term rental space, a data API gives you programmatic access to Airbnb analytics at scale. Instead of manually checking each market in a web dashboard, an API lets you pull short term rental data automatically for hundreds of markets and properties.
AirDNA API: Access to 10 million+ listing records, market-level and property-level short term rental data, ADR, occupancy, revenue estimates. Their API is the most complete for Airbnb data analytics. Pricing is custom based on usage volume – contact AirDNA directly for API rates.
Mashvisor API: Provides both short term and long term rental data through a single API endpoint. Investment metrics, rental comps, property valuations. Starting at enterprise pricing. Best for developers building real estate investment platforms who need both STR and LTR data insights.
AirROI API: Covers 20 million+ properties globally with market insights, dynamic pricing recommendations, and revenue estimates. Their API provides real-time short term rental data analytics for hosts, property managers, and investors. Good for building custom analytics dashboards.
Most individual hosts don’t need API access – the web dashboards from these Airbnb analytics tools provide all the short term rental data insights you need to discover profitable markets and price your properties. The API is for operators at scale who need to automate their short term rental data analysis across large portfolios.
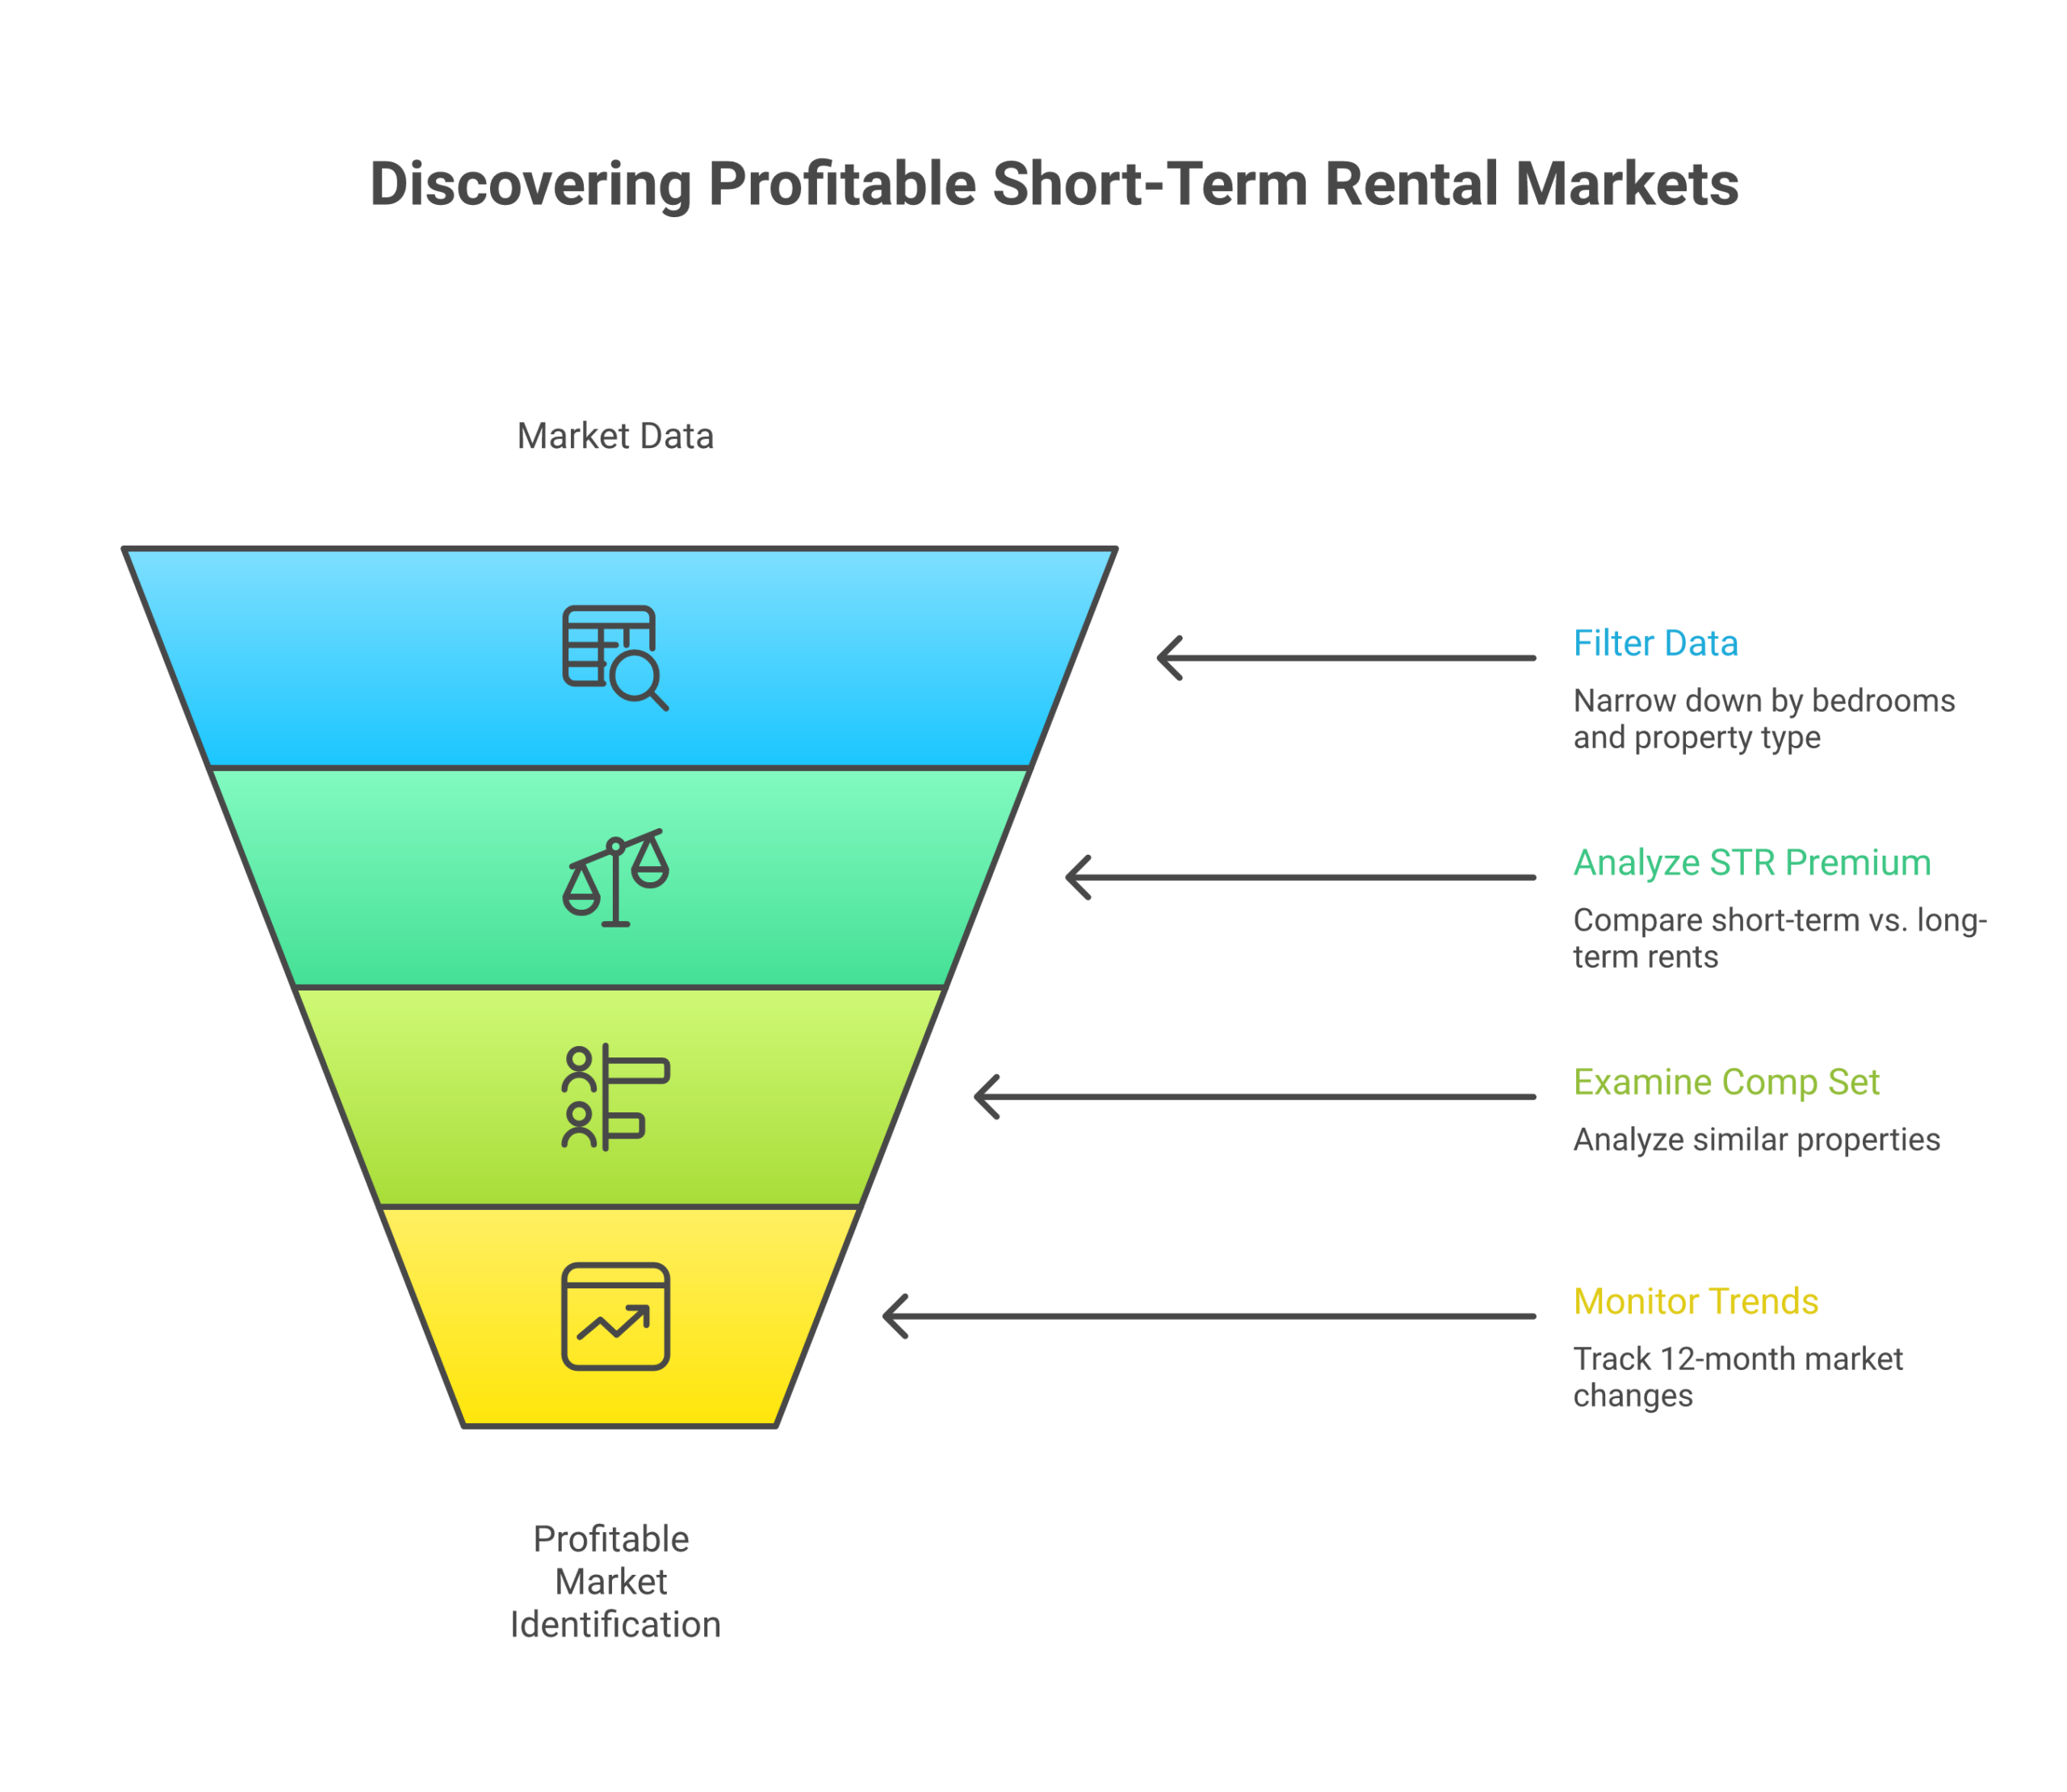
How to Use Airbnb Analytics Tools to Discover Profitable Markets for Investment
Here’s the step-by-step process I teach 10XBNB students for using Airbnb analytics tools to discover the best markets for short term rental investment:
Step 1: Pull market-level data for your target cities. Use AirDNA or Mashvisor to pull short term rental data including ADR, occupancy rates, RevPAN, and supply growth for each market you’re considering. Compare these data insights across 5 to 10 cities to discover which markets have the strongest fundamentals.
Step 2: Filter by bedrooms and property type. Narrow the rental data to your target property configuration – typically 2 to 3 bedrooms for rental arbitrage. The analytics tools let you filter short term rental data by the number of bedrooms, property type (apartment, house, condo), and specific neighborhoods within each market.
Step 3: Discover the STR premium. Compare the short term rental revenue data from your Airbnb analytics tool against long term rental rates from Zillow or local listings. This data comparison helps you discover whether the gap between short term rental income and long term rent is wide enough to justify the investment. I look for markets where the rental data shows a 100%+ STR premium.
Step 4: Analyze the comp set for specific properties. Once you discover a promising market, use your Airbnb analytics tool to pull rental data on 10 to 15 comparable short term rental listings near your target property. Look at their ADR, occupancy, reviews, and revenue estimates. This comp set data from the analytics tools gives you the insights you need to project realistic income for your specific property before you invest.
Step 5: Monitor trends over time. The best Airbnb analytics tools provide historical short term rental data so you can discover whether a market is improving or declining. Look at 6-month and 12-month trends in the data for occupancy, ADR, and supply growth. Markets where the rental data shows rising occupancy with moderate supply growth are the ones where smart hosts and investors are making money right now.
For a detailed walkthrough of market evaluation with real data examples, check our most profitable Airbnb cities ranking where I use this exact analytics process to rank the top markets. Use the rental arbitrage calculator to run the numbers once you’ve discovered a market that looks promising in the data. And if you’re evaluating courses that teach market analysis, our Airbnb courses comparison covers which programs include analytics training.
Frequently Asked Questions
Is AirDNA worth the money?
For property investors making purchase decisions, yes, absolutely. The data quality and depth justify the subscription cost when you’re evaluating six-figure investments. For arbitrage operators or first-time hosts, probably not at first. Start with free tools, and upgrade to AirDNA when your time is worth more than the subscription cost. Most operators hit that point around 3-5 active units.
What’s the best free Airbnb analytics tool?
There’s no single “best” free tool. It’s a combination. Rabbu’s free calculator for quick revenue estimates, manual Airbnb search for competitive analysis, Zillow for rent data, and Google Trends for market demand. Used together, these free methods give you roughly 80% of what a paid tool provides. The 20% gap is mostly historical data depth and time savings.
How accurate are Airbnb revenue estimate tools?
Accuracy varies by market and tool. In major markets with lots of data (Nashville, Austin, Miami), tools like AirDNA are typically within 10-15% of actual revenue. In smaller or newer markets, estimates can be off by 25-40%. Always treat estimates as directional guidance, not guarantees. Cross-reference at least two sources, and validate with manual Airbnb research before making decisions.
Do I need analytics tools for rental arbitrage?
Not in the beginning. Arbitrage analysis is fundamentally about the rent-to-revenue ratio, and you can calculate that manually. Search Airbnb for revenue comps, check Zillow for rent comps, and run the numbers in a spreadsheet. As you scale past 3-5 units, PriceLabs becomes valuable for pricing optimization and market monitoring. AirDNA becomes useful when you’re entering new markets frequently and need to speed up your research process.
What’s the difference between AirDNA and Rabbu?
AirDNA is a pure-play analytics platform with the industry’s deepest STR dataset, 10+ years of historical data, and both global and granular market coverage. It’s the industry standard for serious research. Rabbu is primarily an STR marketplace that offers free analytics tools as part of their ecosystem. Rabbu’s data is decent but less complete than AirDNA’s. Think of Rabbu as a solid free starting point and AirDNA as the premium upgrade when you need deeper data.
Can I use these tools together?
and that’s exactly what I recommend. Use Rabbu for initial screening (it’s free), manual Airbnb search for competitive intelligence (also free), and AirDNA for deep dives on markets that pass your initial filters. Layer in PriceLabs when you’re operational. No single tool gives you everything. The best analysts combine multiple data sources and add their own on-the-ground research.
How often should I check market analytics?
It depends on your stage. Pre-launch, check intensively during your market analysis phase, maybe 2-3 hours total. Once operational, a monthly check-in (30 minutes) to monitor ADR trends, occupancy shifts, and new supply is enough. If you’re using PriceLabs, it monitors and adjusts pricing automatically. So your active time goes way down. Quarterly deep dives are smart for operators with 5+ units, especially when evaluating expansion into new markets.
What metrics matter most for Airbnb market research?
Revenue Per Available Night (RevPAN) is the single most important metric because it combines ADR and occupancy into one number. After that, focus on seasonal revenue variation (to avoid cash flow surprises), supply growth (to gauge saturation risk), and comparable listing performance (to see what properties like yours actually earn). Fancy metrics like “investment grade scores” or “market health ratings” are derived from these core numbers. You don’t need them until you’re evaluating multiple markets simultaneously and need a quick screening shorthand.
The bottom line? Start free. Upgrade strategically. And remember: the best analytics tool is the one that actually leads to a decision. Not the one with the fanciest dashboard.
Ready to start analyzing markets? Grab our free rental arbitrage spreadsheet to organize your research, or check out our full guide on how to start an Airbnb business for the complete step-by-step process from market selection to your first booking.