
I’ve managed Airbnb properties in multiple markets across Canada and I’ve helped over 1,600 students through 10XBNB pick their first market for rental arbitrage and co-listing. The number one question I get is: which cities actually work for Airbnb arbitrage right now? Not last year. Not theoretically. Right now in 2026.
So I pulled the data. AirDNA market reports, AirROI listing data, Zillow rental rates, and booking performance from our own student portfolio across the US. What follows is a data-backed ranking of the most profitable Airbnb cities in 2026, with the actual numbers you need to evaluate whether a market makes sense for your rental arbitrage or co-listing business.
One thing before we get into the cities: the Airbnb market in 2026 is different from 2022. AirDNA’s 2026 Outlook Report (released December 2025) forecasts that average daily rates will grow 1.5% this year while available short term rental listings are projected to grow 4.6%. That means supply is outpacing rate growth in many markets. The cities that still work for Airbnb rental arbitrage are the ones where demand from guests remains strong, occupancy rates stay above 55%, and the STR premium (the gap between Airbnb revenue and long term rent) is wide enough to generate real cash and profit after expenses.
AirDNA’s report called 2026 “the best year to invest in short term rentals since 2021.” I agree with that assessment, but only if you pick the right market. The wrong city will eat your cash flow and cash reserves alive.
See our ranked list of the best cities for mid term rentals with demand drivers and income data for each market.
How We Ranked These Airbnb Cities for Rental Arbitrage and Investment
Every city on this list was evaluated using five data-driven criteria. I’m being transparent about the methodology because too many “best Airbnb cities” lists are based on vibes and anecdotes instead of actual market data. Here’s exactly what I looked at:
1. STR Premium (Airbnb revenue vs long term rent). This is the single most important metric for Airbnb rental arbitrage profitability. The STR premium measures the percentage difference between what a property earns as a short term rental on Airbnb versus what it would earn under a long term lease. A market with a 100%+ STR premium means your Airbnb income is at least double what a long term tenant would pay. For rental arbitrage to be viable after all expenses, I look for markets where the STR premium is at least 80%. Below that, the margins get too thin to cover cleaning, utilities, insurance, and platform fees while still generating meaningful cash flow.
2. Occupancy rate. A city can have high nightly rates but if nobody’s booking, those rates are meaningless. I filter for markets with occupancy rates above 55% on a trailing 12-month basis. The best cities for Airbnb arbitrage maintain 60 to 75% occupancy year-round, not just during peak season. Seasonal markets can work but they require larger cash reserves to cover the slow months when your property sits empty and you’re still paying rent to the landlord.
3. Average daily rate (ADR) vs cost of rent. High ADR sounds great until you realize the rent in that market is also high. What matters for rental arbitrage isn’t the absolute ADR – it’s the ratio between your Airbnb nightly rate and your monthly rent. A city where the average Airbnb earns $150 per night and rent is $1,500 per month is more profitable for arbitrage than a city earning $300 per night with $4,000 rent. The ratio is what drives your cash flow, not the headline number.
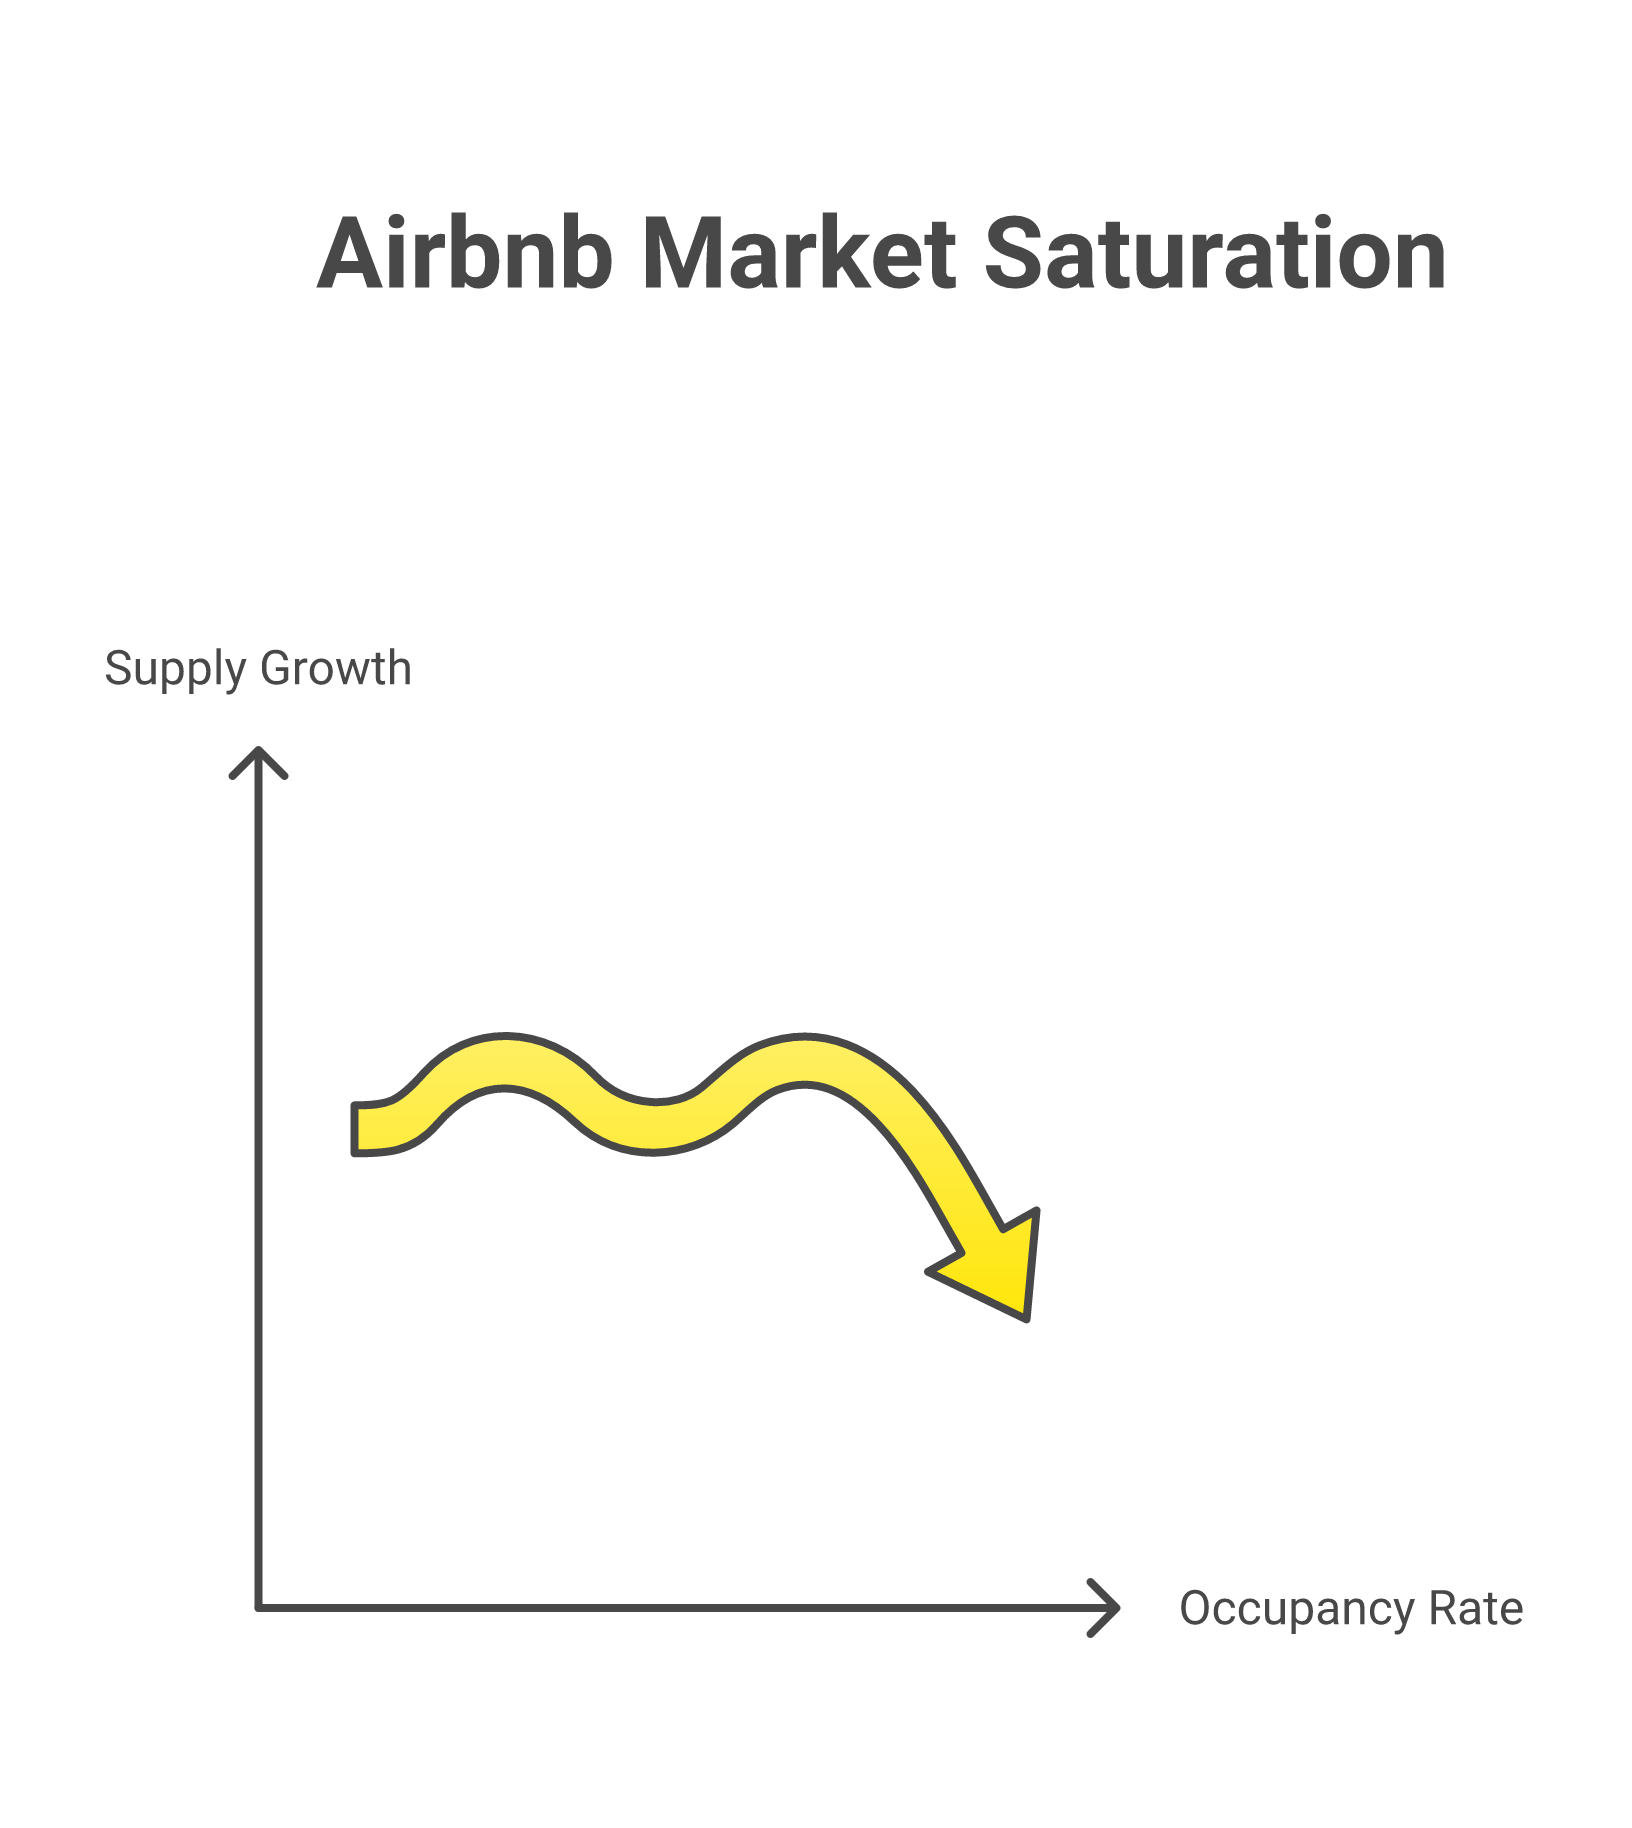
4. Supply growth rate. Markets where short term rental supply is growing faster than 15% annually are showing signs of oversaturation. Too many new Airbnb supply and listings chasing the same pool of guests drives down occupancy and rates for everyone. The best cities for long-term Airbnb arbitrage profitability have moderate supply growth (5 to 12%) with steady or growing demand from travelers, business guests, and event attendees.
5. Regulatory environment. A city can have perfect economics and still be a terrible market for rental arbitrage if the local regulations make it impossible or prohibitively expensive to operate short term rentals. I flag markets where cities have banned short term rentals, imposed strict night caps, require expensive permits, or have pending legislation that could restrict Airbnb operations in the near future.
15 Best Cities for Airbnb Arbitrage in 2026 (Ranked by Profitability)
All data sourced from AirDNA market reports, AirROI listing analytics, and Zillow rental data. Numbers represent trailing 12-month averages as of Q1 2026 unless otherwise noted.
| # | City | ADR | Occupancy | Annual Revenue (est.) | Avg Rent (2BR) | STR Premium | Supply Growth | Arbitrage Verdict |
|---|---|---|---|---|---|---|---|---|
| 1 | Scottsdale, AZ | $413 | 49% | $34,246 | $1,800/mo | ~59% | 14% | Strong – high ADR offsets moderate occupancy |
| 2 | Savannah, GA | $304 | 48% | $29,859 | $1,400/mo | ~78% | 9% | Excellent – low rent, steady tourism demand |
| 3 | Chattanooga, TN | $207 | 50% | $25,500 (est.) | $1,200/mo | ~77% | 11% | Strong – affordable entry, growing market |
| 4 | San Antonio, TX | $185 | 58% | $28,000 (est.) | $1,300/mo | ~79% | 8% | Excellent – high occupancy, low supply growth |
| 5 | Columbus, OH | $165 | 62% | $26,400 (est.) | $1,100/mo | ~100% | 7% | Top pick – highest occupancy, lowest rent |
| 6 | Jacksonville, FL | $195 | 55% | $27,200 (est.) | $1,400/mo | ~62% | 10% | Good – steady demand, moderate competition |
| 7 | Gatlinburg, TN | $367 | 48% | $40,582 | $1,600/mo | ~111% | 12% | Strong – highest revenue but seasonal risk |
| 8 | Gulf Shores, AL | $405 | 43% | $34,748 | $1,500/mo | ~93% | 11% | Good – high ADR, beach market seasonality |
| 9 | Boise, ID | $178 | 69% | $30,000 (est.) | $1,500/mo | ~67% | 13% | Emerging – high occupancy, watch supply |
| 10 | Colorado Springs, CO | $195 | 57% | $28,500 (est.) | $1,600/mo | ~48% | 9% | Moderate – tight margins, needs optimization |
| 11 | Knoxville, TN | $182 | 55% | $24,800 (est.) | $1,100/mo | ~88% | 10% | Strong – low rent makes arbitrage math work |
| 12 | Tampa, FL | $220 | 54% | $29,500 (est.) | $1,800/mo | ~37% | 11% | Moderate – high rent squeezes margins |
| 13 | Tulsa, OK | $140 | 58% | $22,000 (est.) | $900/mo | ~104% | 6% | Sleeper pick – lowest entry cost, high STR premium |
| 14 | Springfield, IL | $129 | 62% | $29,283 | $850/mo | ~187% | 5% | Best STR premium on the list |
| 15 | Abilene, TX | $145 | 82% | $32,000 (est.) | $900/mo | ~196% | 4% | Highest occupancy + lowest entry – top arbitrage pick |
Data Sources and Notes
ADR, occupancy, and annual revenue figures for Scottsdale, Savannah, Gatlinburg, Gulf Shores, and Nashville sourced from AirROI trailing 12-month data (20M+ Airbnb listings analyzed). Abilene and Springfield data from AirDNA’s 2026 Best Places to Invest rankings. Chattanooga, Boise, and Knoxville RevPAN data cross-referenced with Rakidzich’s market analysis (100+ active properties). Rent estimates from Zillow Observed Rent Index (ZORI) for 2-bedroom apartments as of Q1 2026. STR premium calculated as (annual Airbnb revenue / annual rent – 1) x 100.
Estimates marked “(est.)” are calculated from ADR x occupancy x 365 using verified ADR and occupancy data. All data is publicly available and can be independently verified at airdna.co, airroi.com, and zillow.com/research/data.
Top 5 Rental Arbitrage Cities: Where the Math Works Best
The table above ranks cities by overall Airbnb investment potential. But rental arbitrage has different economics than property ownership. When you’re doing arbitrage, your monthly rent is your biggest fixed cost. So the cities that matter most for rental arbitrage are the ones where the gap between Airbnb income and long term rent is widest.
Based on that filter, here are the top 5 cities for Airbnb rental arbitrage specifically:
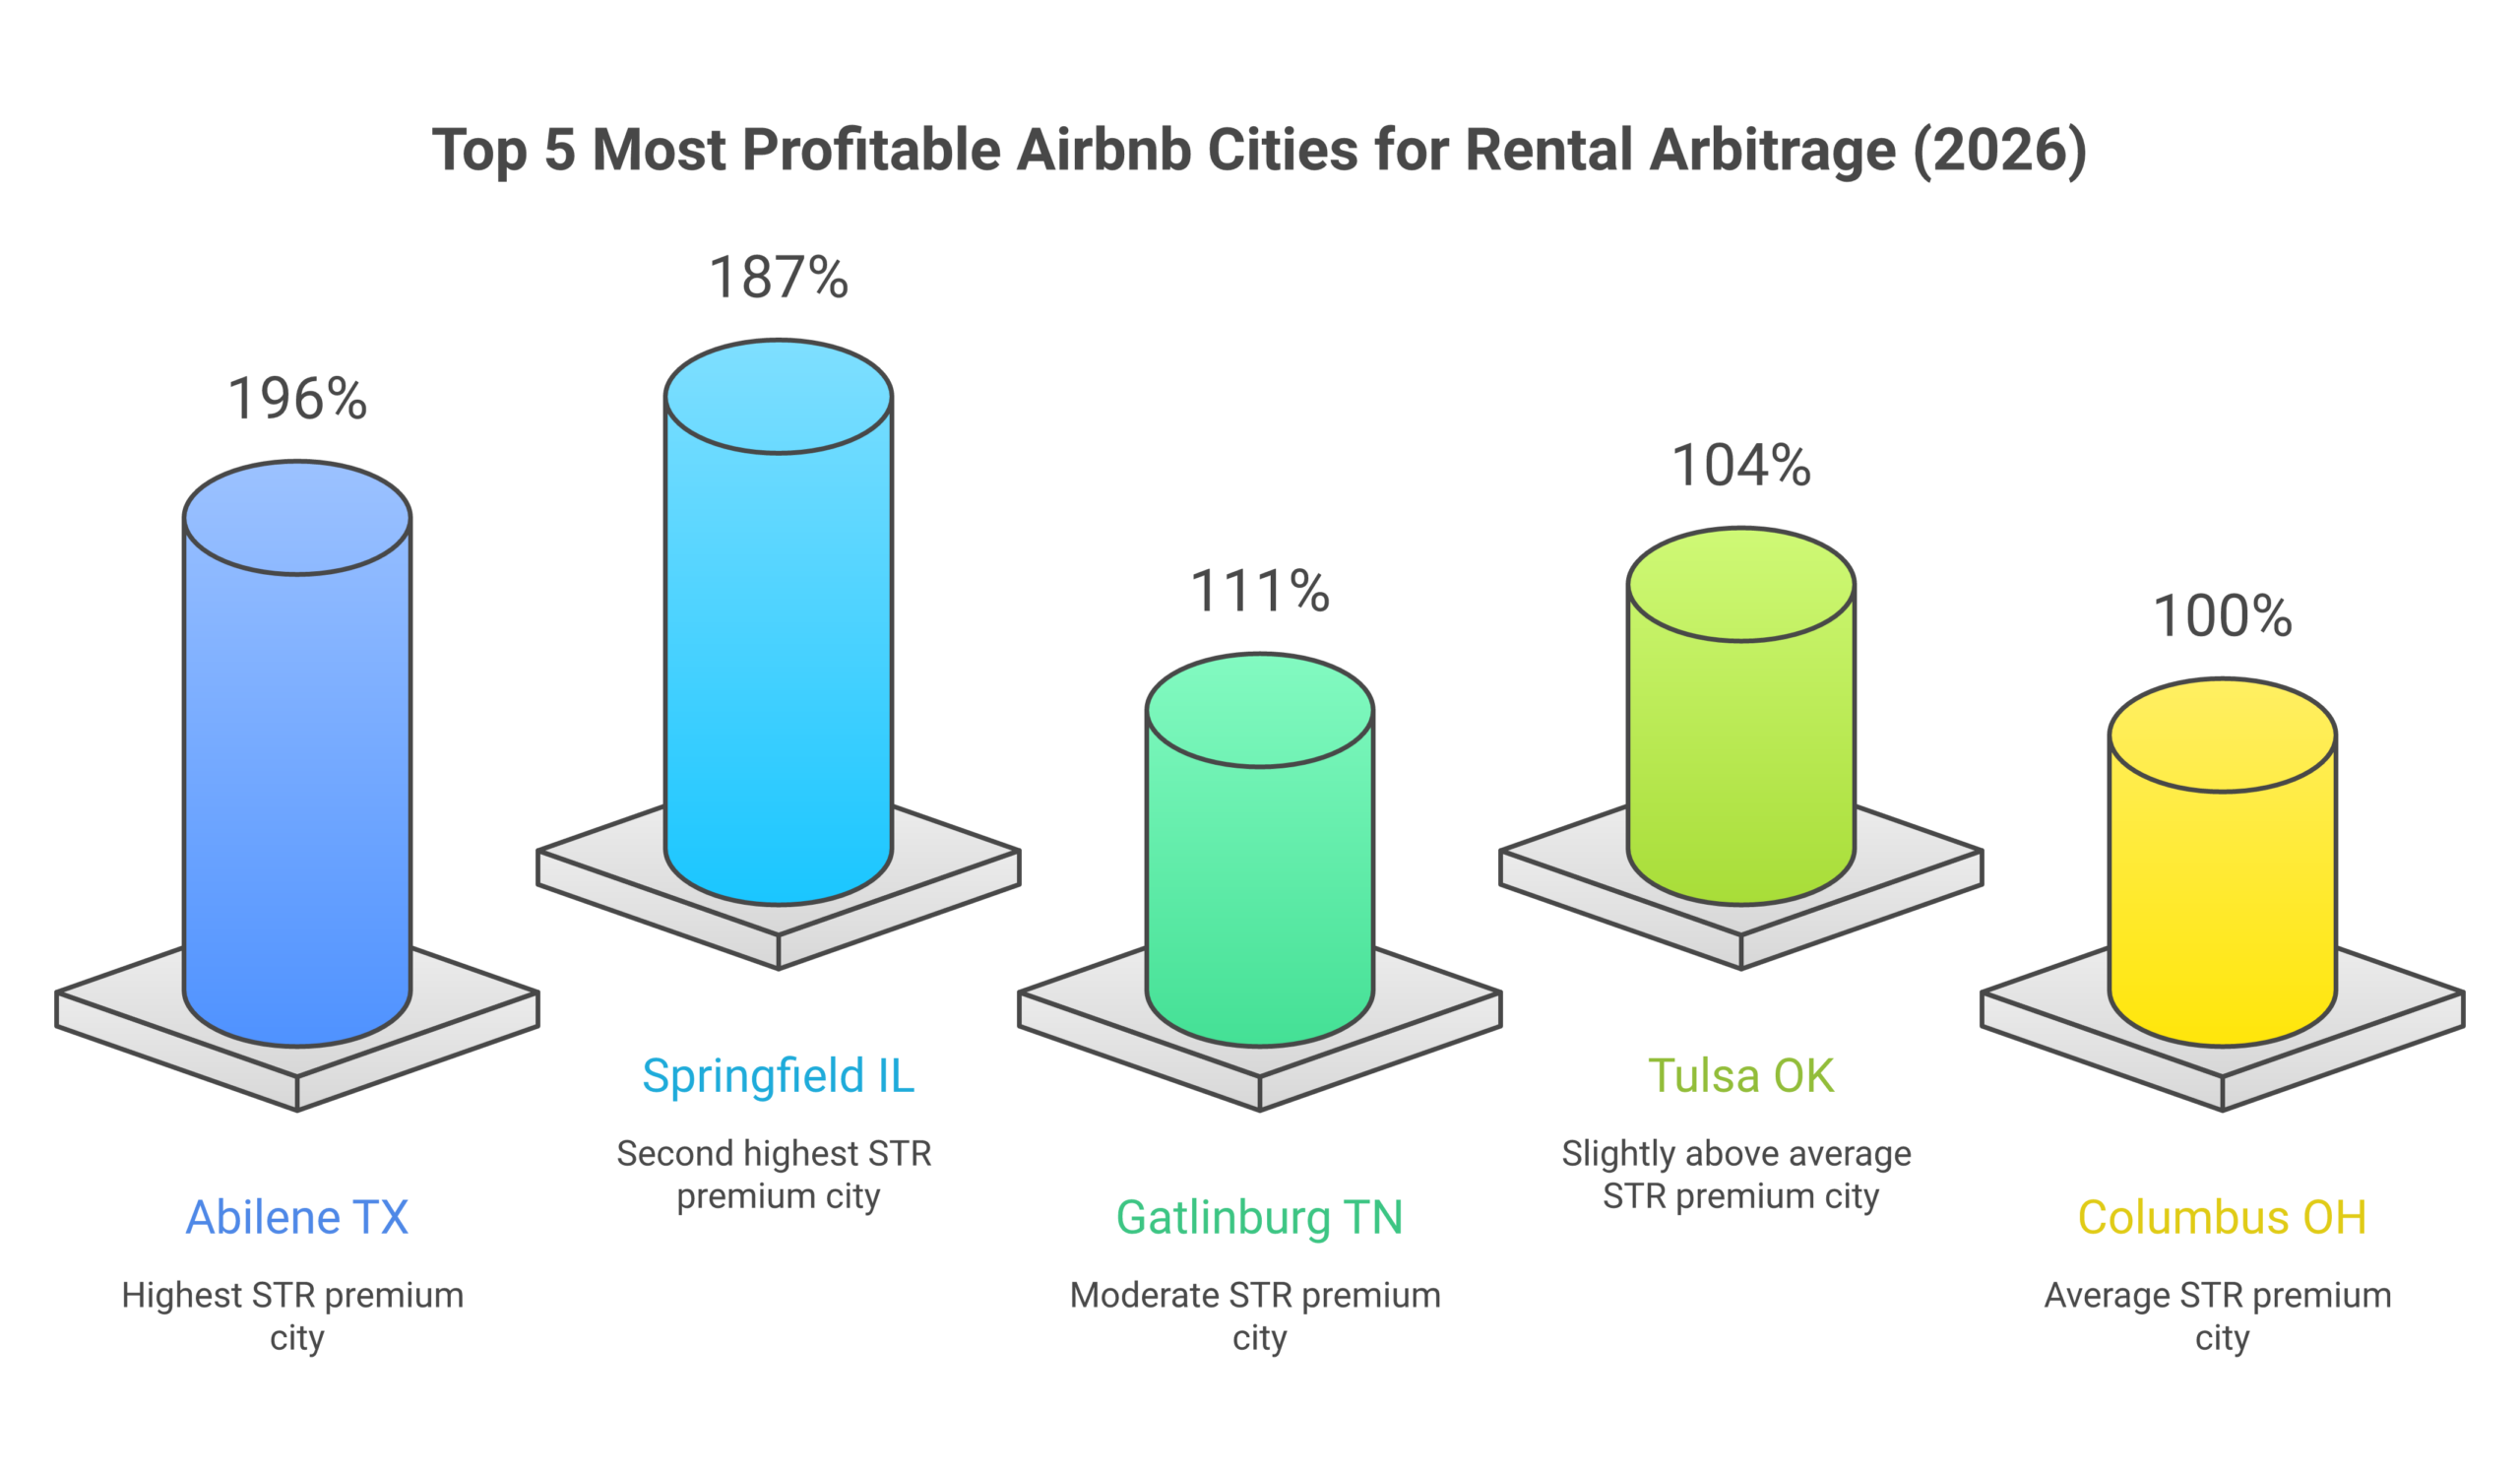
1. Abilene, TX: 82% occupancy (highest on the list), $900 average monthly rent for a 2-bedroom, estimated $32,000 annual Airbnb revenue. That’s a 196% STR premium, meaning your Airbnb income is nearly triple what a long term tenant would pay. The low entry cost ($900 first month + $900 deposit + $2,000 furnishing = under $4,000 to start) makes this the most accessible market for first-time rental arbitrage operators. Supply growth at 4% means the market isn’t being flooded with new Airbnb listings. The demand in Abilene comes from military (Dyess Air Force Base), oil and gas workers, and university travelers, providing year-round occupancy stability.
2. Springfield, IL: 62% occupancy, $850 average rent, $29,283 annual revenue (AirDNA verified). That’s a 187% STR premium on an $850 monthly investment. Springfield’s demand comes from state government, healthcare (multiple hospitals), and university travelers. The 5% supply growth rate means the market is far from saturated. This is one of those cities where most Airbnb rental arbitrage operators can outperform market averages by 30 to 40% simply because most of the existing listings are run by amateur hosts with poor photos, static pricing, and no optimization.
3. Tulsa, OK: 58% occupancy, $900 average rent, estimated $22,000 annual revenue. 104% STR premium. What makes Tulsa interesting for Airbnb arbitrage is the Gathering Place effect. Since the Gathering Place park opened (ranked #1 park in the US by USA Today), tourism to Tulsa has increased steadily. Combined with oil and gas corporate travel and a growing music and arts scene, Tulsa has diversified demand that isn’t dependent on one seasonal driver.
4. Columbus, OH: 62% occupancy, $1,100 average rent, estimated $26,400 annual revenue. 100% STR premium, meaning your Airbnb income is double your rent. Columbus has Ohio State University (66,000+ students plus visiting families for every football game), a growing tech sector, and multiple healthcare systems driving year-round demand. The 7% supply growth is moderate and the market has room for well-operated Airbnb rental arbitrage properties.
5. Gatlinburg, TN: 48% occupancy, $1,600 average rent, $40,582 annual revenue (AirDNA verified). 111% STR premium. Gatlinburg is the highest gross revenue market on this list at over $40,000 annually. The catch: 48% occupancy means significant seasonality. Summer and fall are packed with tourists visiting Great Smoky Mountains National Park (the most visited national park in the US with 12.1 million visitors in 2023). Winter and early spring are slow. If you’re doing rental arbitrage in Gatlinburg you need 3 months of rent saved as reserves because those slow months will test your cash flow.
Airbnb Markets to Approach With Caution in 2026
Not every popular Airbnb market is good for rental arbitrage. These cities have warning signs that operators need to understand before signing a lease:
Nashville, TN: 6,845 active Airbnb listings competing for guests, 47% occupancy (AirROI data), and average daily rates of $347. Nashville used to be the poster child for Airbnb rental arbitrage. But the combination of oversaturation (nearly 7,000 listings), declining occupancy rates, and increasingly strict short term rentals regulations make it a riskier proposition than it was 3 years ago. It can still work if you pick the right property and optimize aggressively, but it’s not the easy market it used to be. I’d recommend Nashville for experienced rental arbitrage operators, not beginners.
Austin, TX: Occupancy dropped from approximately 68-70% to around 60% over the past 18 months while supply continues growing. Austin also has aggressive short term rental licensing requirements with Type 2 licenses (non-owner-occupied) in declining availability. The economics are tightening.
Panama City Beach, FL: 10,418 active Airbnb listings with 44% occupancy and $341 ADR (AirROI data). The sheer number of competing listings in this beach market means your property needs to be significantly above average to maintain consistent bookings. Seasonal demand drops hard outside of summer months.
2026 FIFA World Cup: Three Cities With Above-Trend Growth
AirDNA’s 2026 Outlook Report flagged three US host cities showing above-trend RevPAR growth forecasts driven by FIFA World Cup demand:
Philadelphia: +6.3% RevPAR growth forecast. If you can secure a rental arbitrage property within 30 minutes of Lincoln Financial Field before the tournament, the summer 2026 pricing opportunity is significant.
Jersey City/Newark: +5.6% RevPAR growth forecast. Proximity to MetLife Stadium (the World Cup final venue) makes this market particularly strong for short-term rental arbitrage through June-July 2026.
Dallas: +5.5% RevPAR growth forecast. AT&T Stadium will host multiple matches, driving hotel overflow demand directly into Airbnb and short term rentals properties.
These are short-term opportunities – the World Cup pricing bump won’t last beyond summer 2026. But if you’re already operating rental arbitrage in one of these cities or can set up quickly, the revenue boost from World Cup guests could be substantial.
How Shaun Evaluates Any Airbnb Market for Rental Property Investment
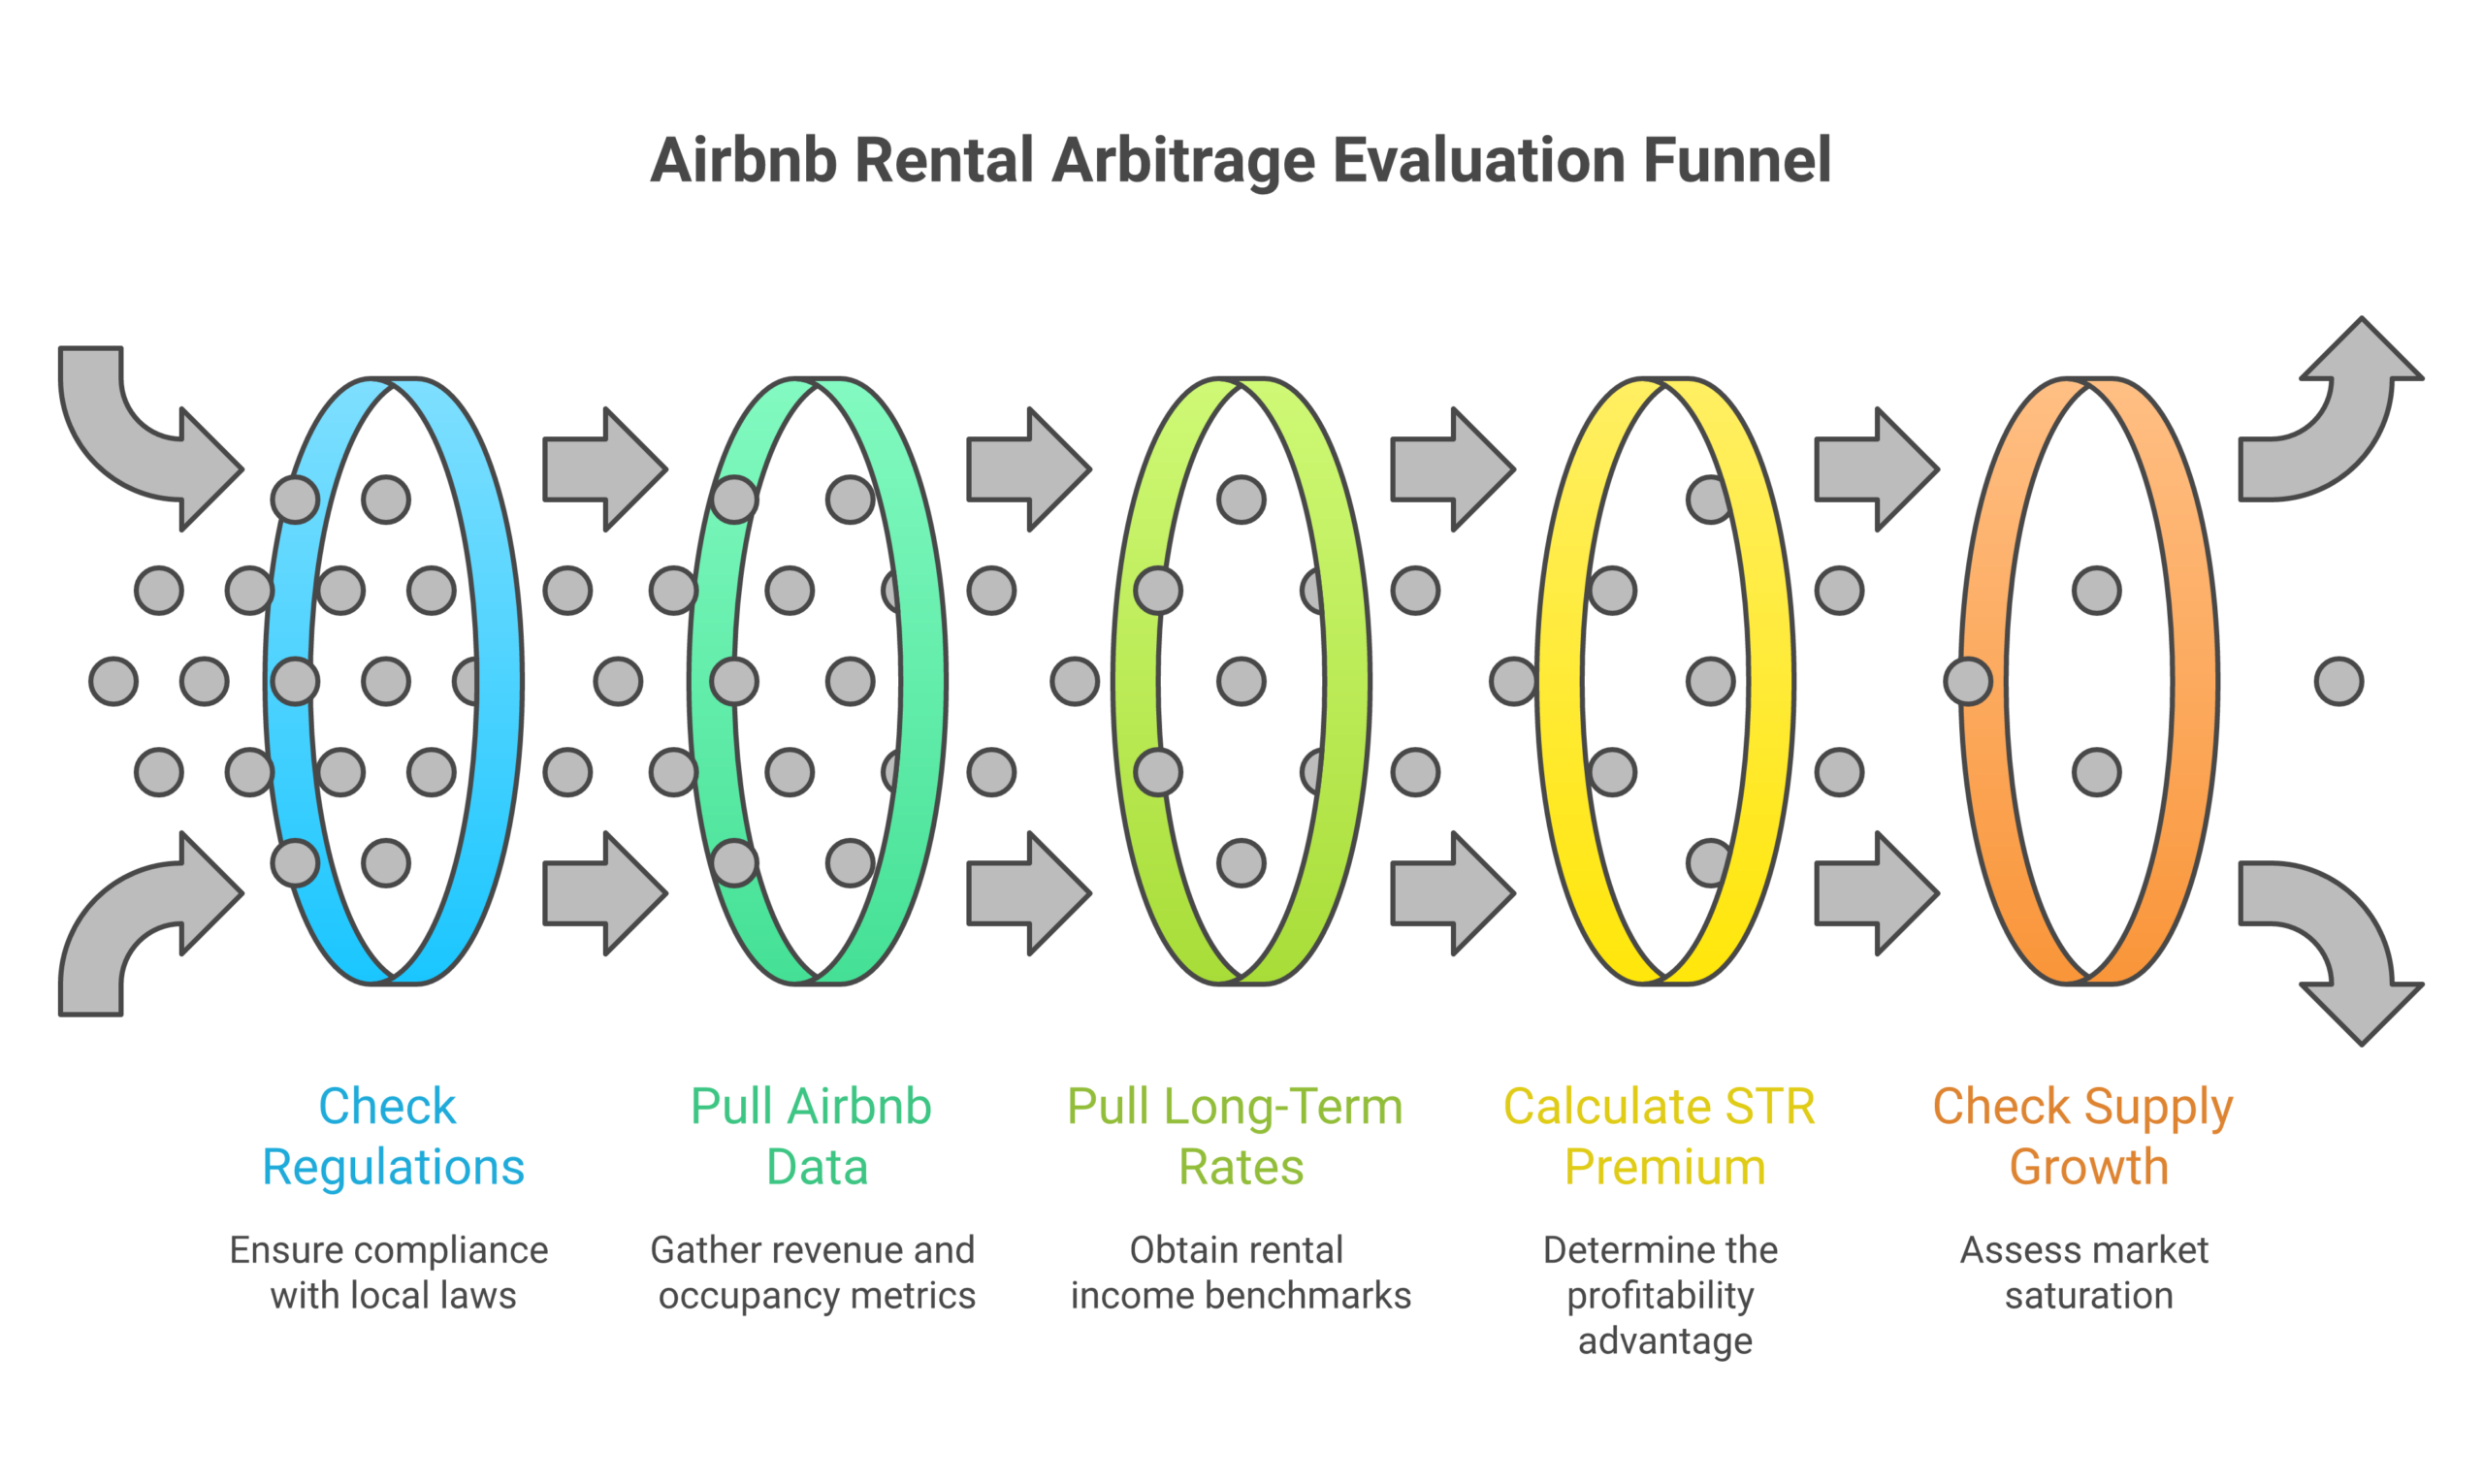
I’ve evaluated hundreds of markets over the years and I’ve boiled my process down to a 5-step analysis I run on every city before I put a single dollar into it. This is the same process I teach inside the 10XBNB co-host training program:
Step 1: Check regulations first. Before looking at a single Airbnb revenue number, I search “[City name] short term rentals regulations 2026” and read the city’s actual ordinance. If the city bans short term rentals, caps nights at 90 days or fewer, or requires permits that cost thousands of dollars, I move on. No amount of good economics matters if you can’t legally operate.
Step 2: Pull Airbnb revenue data. Use AirDNA or search the Airbnb arbitrage calculator for your target property type (2BR apartment, 3BR house, etc.) in that specific city. Note the average daily rate, occupancy rate, and estimated annual revenue. These are your top-line income numbers.
Step 3: Pull long term rental data. Search Zillow, Apartments.com, or Craigslist for the same property type in the same area. What’s the average monthly rent? This is your biggest fixed cost in rental arbitrage.
Step 4: Calculate the STR premium. Divide your estimated annual Airbnb revenue by your annual rent cost. If the ratio is 2.0 or higher (100%+ STR premium), the market is viable for rental arbitrage. Between 1.5 and 2.0 (50-100% premium) it can work but margins are tight. Below 1.5 – walk away.
Step 5: Check supply trends. Look at how many new Airbnb listings have been added in the past 12 months versus how many were there a year ago. AirDNA shows this data. If supply growth exceeds 15%, the market may be oversaturating. Compare that growth rate to the demand growth (bookings, occupancy trends) to see if demand is keeping pace with new supply.
If a market passes all five filters, it goes on my shortlist. Then I run a deeper analysis on specific properties within that market using the rental arbitrage calculator before committing to a lease. For a broader market comparison that includes buy-and-hold strategies alongside arbitrage, see our best Airbnb markets 2026 analysis.
Why Co-Listing Is the Lowest Risk Way to Enter Any Airbnb Market
Here’s something most “best cities” guides won’t tell you: you don’t have to sign a lease in any of these markets to start making money from Airbnb. The co-listing model I teach inside 10XBNB lets you manage other people’s Airbnb properties for a 20 to 25% commission with zero financial risk. No lease. No rent payments. No furnishing costs. No cash flow risk during slow months.
Co-listing is how I started and it’s how I recommend every new operator enters a market. You learn the local market dynamics, build relationships with property owners, and generate income before committing $5,000 to $12,000 to a rental arbitrage lease. If a market turns out to be oversaturated or the regulations change, you can walk away with zero financial loss. Try doing that with an active lease.
Our 10XBNB students like Javon in Arizona and John in Vancouver both started with co-listing before transitioning to rental arbitrage. Javon landed his first co-listing clients within 60 days. John generated $50,000 in bookings from 4 co-listed properties in 3 months. Neither of them signed a lease until they had proven the market worked with real revenue data from properties they were already managing.
That’s the progression I recommend: co-listing first, then rental arbitrage when you’ve got the cash flow and market knowledge to make it work. Read the full breakdown in our startup costs guide and the Airbnb courses comparison to understand how different programs approach market selection. If you are ready to take the first step, our how to start a rental arbitrage business guide walks through the full process from market research to first booking.
Airbnb Investment Analysis: Understanding Property Economics Across Markets
Picking a profitable Airbnb market is only step one. The real investment decision comes down to the specific property you choose within that market. Two properties on the same street can have completely different investment returns based on their size, layout, amenities, and how well the listing is optimized. Here’s how to evaluate individual Airbnb investment properties within any market on this list.
Property type matters for your investment returns. In my experience managing 24 short term rentals properties, 2 to 3 bedroom properties consistently outperform studios and 1-bedrooms for Airbnb rental arbitrage investment. The reason: a 2-bedroom property costs maybe 30% more in monthly rent than a 1-bedroom but can earn 60 to 80% more in Airbnb nightly rates because it sleeps more guests. That extra bedroom dramatically improves your investment returns on the property.
Location within the market drives property rates. A property 10 minutes from downtown in Savannah earns significantly different rates than a property 30 minutes outside the city. When analyzing any Airbnb market, drill into specific neighborhoods. The average market rates and occupancy numbers I listed in the table above represent the entire market. Your specific property in a prime location within that market should outperform those averages if you optimize the listing correctly.
Amenities that justify higher rates on your property. Hot tubs, pools, game rooms, and pet-friendly policies allow hosts to charge premium rates on their short term rentals properties. In markets like Gatlinburg and Gulf Shores, properties with hot tubs earn 15 to 25% higher nightly rates than comparable properties without them. That amenity investment on the property pays for itself within the first few months of higher rates and increased bookings from guests searching specifically for those features.
Calculate your property-specific investment returns. Don’t use market averages for your final investment decision. Use the Airbnb arbitrage calculator with the specific property’s projected rates, the actual rent you’ll pay, and realistic expense estimates. Your investment return on a specific property in a profitable market could be 50% higher or lower than the market average depending on the property itself.
Short Term Rental Regulations by Market: What Investors and Hosts Need to Know
Regulations can make or break your Airbnb rental arbitrage investment in any market. Here’s the regulatory landscape for the top markets on this list as of 2026:
Scottsdale, AZ: Arizona state law preempts local short term rentals bans, meaning cities cannot prohibit Airbnb properties. However, Scottsdale requires short term rental registration and has nuisance ordinances. Relatively favorable regulatory environment for short term rentals investment compared to many markets.
Savannah, GA: Savannah requires a short term vacation rental permit. Properties must be in approved zones. The permit process is straightforward but there’s a cap on the number of permits in the historic district. Properties outside the historic district face fewer restrictions. Check the city’s STVR overlay map before investing in a property in this market.
Gatlinburg, TN: One of the most Airbnb-friendly markets in the country. The entire city economy is built around short term rentals tourism. Permits are required but readily available. Property taxes on short term rental properties are higher than residential rates, which is an investment cost to account for.
Columbus, OH: Ohio has moderate short term rentals regulations. Columbus requires Airbnb hosts to register and collect lodging taxes. No night caps or property type restrictions as of 2026. Good regulatory environment for rental arbitrage investment.
Abilene, TX: Texas state law generally preempts local short term rental bans. Abilene has minimal STR-specific regulations beyond standard rental property registration. Very favorable for short term rentals investment.
For every market you consider, verify current regulations by searching the city’s official website for their short term rental ordinance. Regulations change frequently and what was true 6 months ago may not be true today. This is one reason I recommend starting with co-listing in a new market before committing to a rental arbitrage lease – if regulations change, you have no lease obligation to worry about.
Rate Optimization Strategies for Different Airbnb Markets
The nightly rates you charge on your Airbnb properties should vary dramatically based on which market you’re operating in. Here’s how I approach rate strategy across different types of markets:
Tourism-driven markets (Gatlinburg, Gulf Shores, Scottsdale): These markets have extreme seasonality in their rates. Peak season rates can be 2 to 3 times your off-season rates. Use dynamic pricing tools aggressively in these markets because manually adjusting rates for dozens of seasonal variables is impossible. Your Airbnb property rates should respond to local events, weather patterns, competitor pricing, and booking lead time. In Gatlinburg specifically, fall foliage season (October) commands the highest rates of the year – even higher than summer.
Business travel markets (Columbus, San Antonio, Springfield): Rates in business travel markets are more stable throughout the year but drop on weekends when business travelers go home. Set higher weekday rates and lower weekend rates. Mid-week occupancy drives your revenue in these markets, not weekend getaways. If weekday occupancy is strong but weekends are slow, consider a mid-term rental arbitrage hybrid where you offer 30+ day stays at a discount to fill gaps. Properties near convention centers, hospitals, and corporate campuses command premium rates from business guests who book short term rental properties as an alternative to hotels.
Emerging markets (Abilene, Tulsa, Chattanooga): Your rates in emerging Airbnb markets should start 10 to 15% below established competitors to build reviews and occupancy quickly. Once you have 15+ five-star reviews on your property, gradually increase rates. In these markets, most existing short term rental hosts are amateurs with poor photos and static rates, so a well-optimized property with dynamic pricing will quickly outperform the market average.
Event-driven opportunities (Philadelphia, Dallas, Jersey City for FIFA 2026): Set maximum rates aggressively for known event dates. During the FIFA World Cup, Airbnb properties near stadiums in host cities could command 3 to 5 times normal nightly rates. Block those dates now and set premium rates. Guests who need accommodation during major events are willing to pay significantly higher rates than normal travelers.
How to Find Landlords Who Allow Airbnb Rental Arbitrage
Finding the right city is only half the battle. The other half is finding a landlord willing to let you sublease their property as a short term rental. In my experience, about 1 in 10 landlords will say yes to an arbitrage arrangement if you approach them correctly. Here is what works.
Target individual landlords, not property management companies. Individual owners are far more likely to approve arbitrage than corporate property managers. Search Craigslist, Zillow rentals, and Facebook Marketplace for listings posted directly by owners. Look for phrases like “landlord pays utilities” or “owner-managed” in the listing description.
Lead with the value proposition. When you pitch a landlord, focus on what they get: guaranteed on-time rent, a professionally maintained property, regular cleaning, and a tenant who treats the unit like a business asset. Most landlords worry about damage and noise. Address those concerns upfront with your insurance policy, guest screening process, and noise monitoring plan.
Offer above-market rent. If average 2-bedroom rent in Columbus is $1,100 per month, offer $1,200 or $1,250. That 10-15% premium costs you $100 to $150 per month but dramatically increases your approval rate. When your annual Airbnb revenue is $26,000+, that extra rent is a rounding error.
Get it in writing. Always add an addendum to your lease that explicitly permits short term rental use. Include specifics: maximum guest count, your insurance coverage amounts, your commitment to maintaining the property. A clear written agreement protects both you and the landlord. Download our free deal analyzer spreadsheet to run the numbers before making any offer.
Start with co-listing to build your pitch. If you already manage 2 to 3 co-listed properties with 4.8+ star ratings and zero complaints, you have proof that you run a professional operation. Landlords respond much better to “I already manage 3 properties with perfect reviews” than “I want to try Airbnb in your apartment.”
Frequently Asked Questions About the Best Cities for Airbnb Arbitrage
What is the most profitable city for Airbnb in 2026?
By gross revenue, Gatlinburg TN leads at $40,582 annual revenue per listing (AirDNA data). For rental arbitrage specifically, Abilene TX offers the best combination: 82% occupancy, $900/month rent, and a 196% STR premium making it the most profitable arbitrage market for operators who prioritize cash flow over headline revenue.
How do I calculate if a city works for Airbnb rental arbitrage?
Calculate the STR premium: (estimated annual Airbnb revenue / annual rent) – 1. A result above 1.0 (100% premium) means your Airbnb income is double your rent, which is ideal. Between 0.5 and 1.0 is workable with tight expense management. Below 0.5, the margins are too thin for rental arbitrage to be profitable after expenses.
Are small cities better for Airbnb arbitrage than big cities?
Often yes. Small and mid-size cities like Abilene, Springfield, Tulsa, and Columbus offer lower entry costs (rent under $1,200/month), less competition from established Airbnb hosts, and higher STR premiums because the gap between long term rent and short term rental rates is wider. Big cities like New York, San Francisco, and Los Angeles have high revenue but also high rent, heavy competition, and strict regulations that make rental arbitrage much harder.
What occupancy rate do I need for Airbnb arbitrage to work?
At minimum 50% on a trailing 12-month basis. Below that, you’ll have too many empty nights and your cash flow will be negative after rent and expenses. Ideal occupancy for rental arbitrage profitability is 55 to 70%. Markets above 70% occupancy are rare and typically indicate very strong demand.
How does the 2026 FIFA World Cup affect Airbnb markets?
AirDNA forecasts above-trend RevPAR growth in Philadelphia (+6.3%), Jersey City/Newark (+5.6%), and Dallas (+5.5%) due to World Cup demand. If you’re operating rental arbitrage in or near these cities, expect higher nightly rates and occupancy during the tournament (June-July 2026). This is a short-term boost, not a permanent market shift.
What’s the cheapest city to start Airbnb rental arbitrage?
Markets with rent under $1,000 per month offer the lowest barrier to entry. Tulsa OK ($900 avg rent), Springfield IL ($850), and Abilene TX ($900) all allow you to launch your first rental arbitrage property for under $4,000 total (first month rent + deposit + basic furnishing). If you want to start with literally $0, the co-listing model requires zero capital in any market.
Should I avoid oversaturated Airbnb markets?
Not necessarily avoid, but approach with caution and better data. Nashville (6,845 listings, 47% occupancy) and Panama City Beach (10,418 listings, 44% occupancy) are oversaturated by raw numbers. But within those markets there are specific neighborhoods and property types that still perform well. The key is having strong dynamic pricing tools, professional listing optimization, and operational excellence to stand out from amateur operators. For beginners, I recommend starting in a less competitive market first.
What are the best rental arbitrage cities for beginners in 2026?
For beginners, the best rental arbitrage cities combine low startup costs with forgiving margins. Abilene TX ($900 rent, 196% STR premium), Tulsa OK ($900 rent, 104% STR premium), and Springfield IL ($850 rent, 187% STR premium) all allow you to start for under $4,000. These markets also have less competition from experienced operators, so a well-optimized listing can quickly outperform the local average. If you want zero financial risk, start with co-listing in any of these markets first.
Where do 10XBNB students have the most success with rental arbitrage?
Our students report the strongest results in mid-size cities with diversified demand: places like Columbus, San Antonio, Chattanooga, and Jacksonville. These markets combine reasonable entry costs, strong occupancy, manageable competition, and landlords who are more open to Airbnb rental arbitrage arrangements because the short term rental market isn’t as politicized as it is in tourist-heavy destinations.