
A vacation rental property’s value comes down to one question: how much money can it make? Unlike a traditional home where comparables drive the price, short-term rentals (STRs) are income-producing assets. The property that generates $80,000 in annual revenue is worth more than the identical house next door pulling in $40,000. I’ve helped hundreds of students evaluate rental properties through the 10XBNB program, and the single biggest mistake I see is relying on Zillow’s estimate instead of running the actual income numbers.
This guide breaks down every metric, formula, and data source you need to accurately value a vacation rental property in 2026, whether you’re buying your first investment property or evaluating an existing portfolio.
Why Vacation Rental Valuation Differs from Traditional Real Estate
Traditional residential appraisals compare your home to recent sales of similar homes nearby. That approach misses the most important variable for STRs: rental income potential. Two identical condos on the same street can have wildly different values if one consistently books at $250 per night with 75% occupancy while the other averages $150 per night at 50% occupancy.
The difference comes from factors that traditional appraisals ignore entirely: listing quality, review scores, dynamic pricing strategy, guest experience, and local market demand. A 2024 AirDNA analysis found that top-performing STR operators in the same market earn 2 to 3 times more revenue than average hosts on identical property types. That revenue gap directly translates to a property value gap.
Three valuation methods apply to vacation rental properties:
| Method | How It Works | Best For |
|---|---|---|
| Income Approach | Value = Net Operating Income / Cap Rate | Active STRs with 12+ months of revenue data |
| Sales Comparison | Compare to recent sales of similar properties | Markets with enough comparable STR sales |
| Cost Approach | Land value + replacement cost minus depreciation | New construction or unique properties |
For vacation rentals, the income approach almost always gives the most accurate picture. The rest of this guide focuses on getting that calculation right.
Net Operating Income (NOI): The Foundation of Vacation Rental Value
Net operating income is the single most important number in vacation rental valuation. It tells you how much the property actually earns after all operating costs, but before mortgage payments. The formula is simple:
NOI = Gross Rental Income – Operating Expenses
Getting an accurate NOI requires honest accounting on both sides of that equation.
Calculating Gross Rental Income
Start with actual booking data when possible. For an existing STR, pull 12 months of revenue from your property management software or platform payouts. If you’re evaluating a property you haven’t purchased yet, use AirDNA or a comparable analytics tool to estimate revenue based on similar listings in the area.
Your gross income calculation should include:
- Nightly rental revenue from all platforms (Airbnb, Vrbo, direct bookings)
- Cleaning fees collected from guests
- Pet fees, early check-in fees, and other ancillary income
Do not include security deposit refunds, platform payouts before fees, or one-time insurance claims.
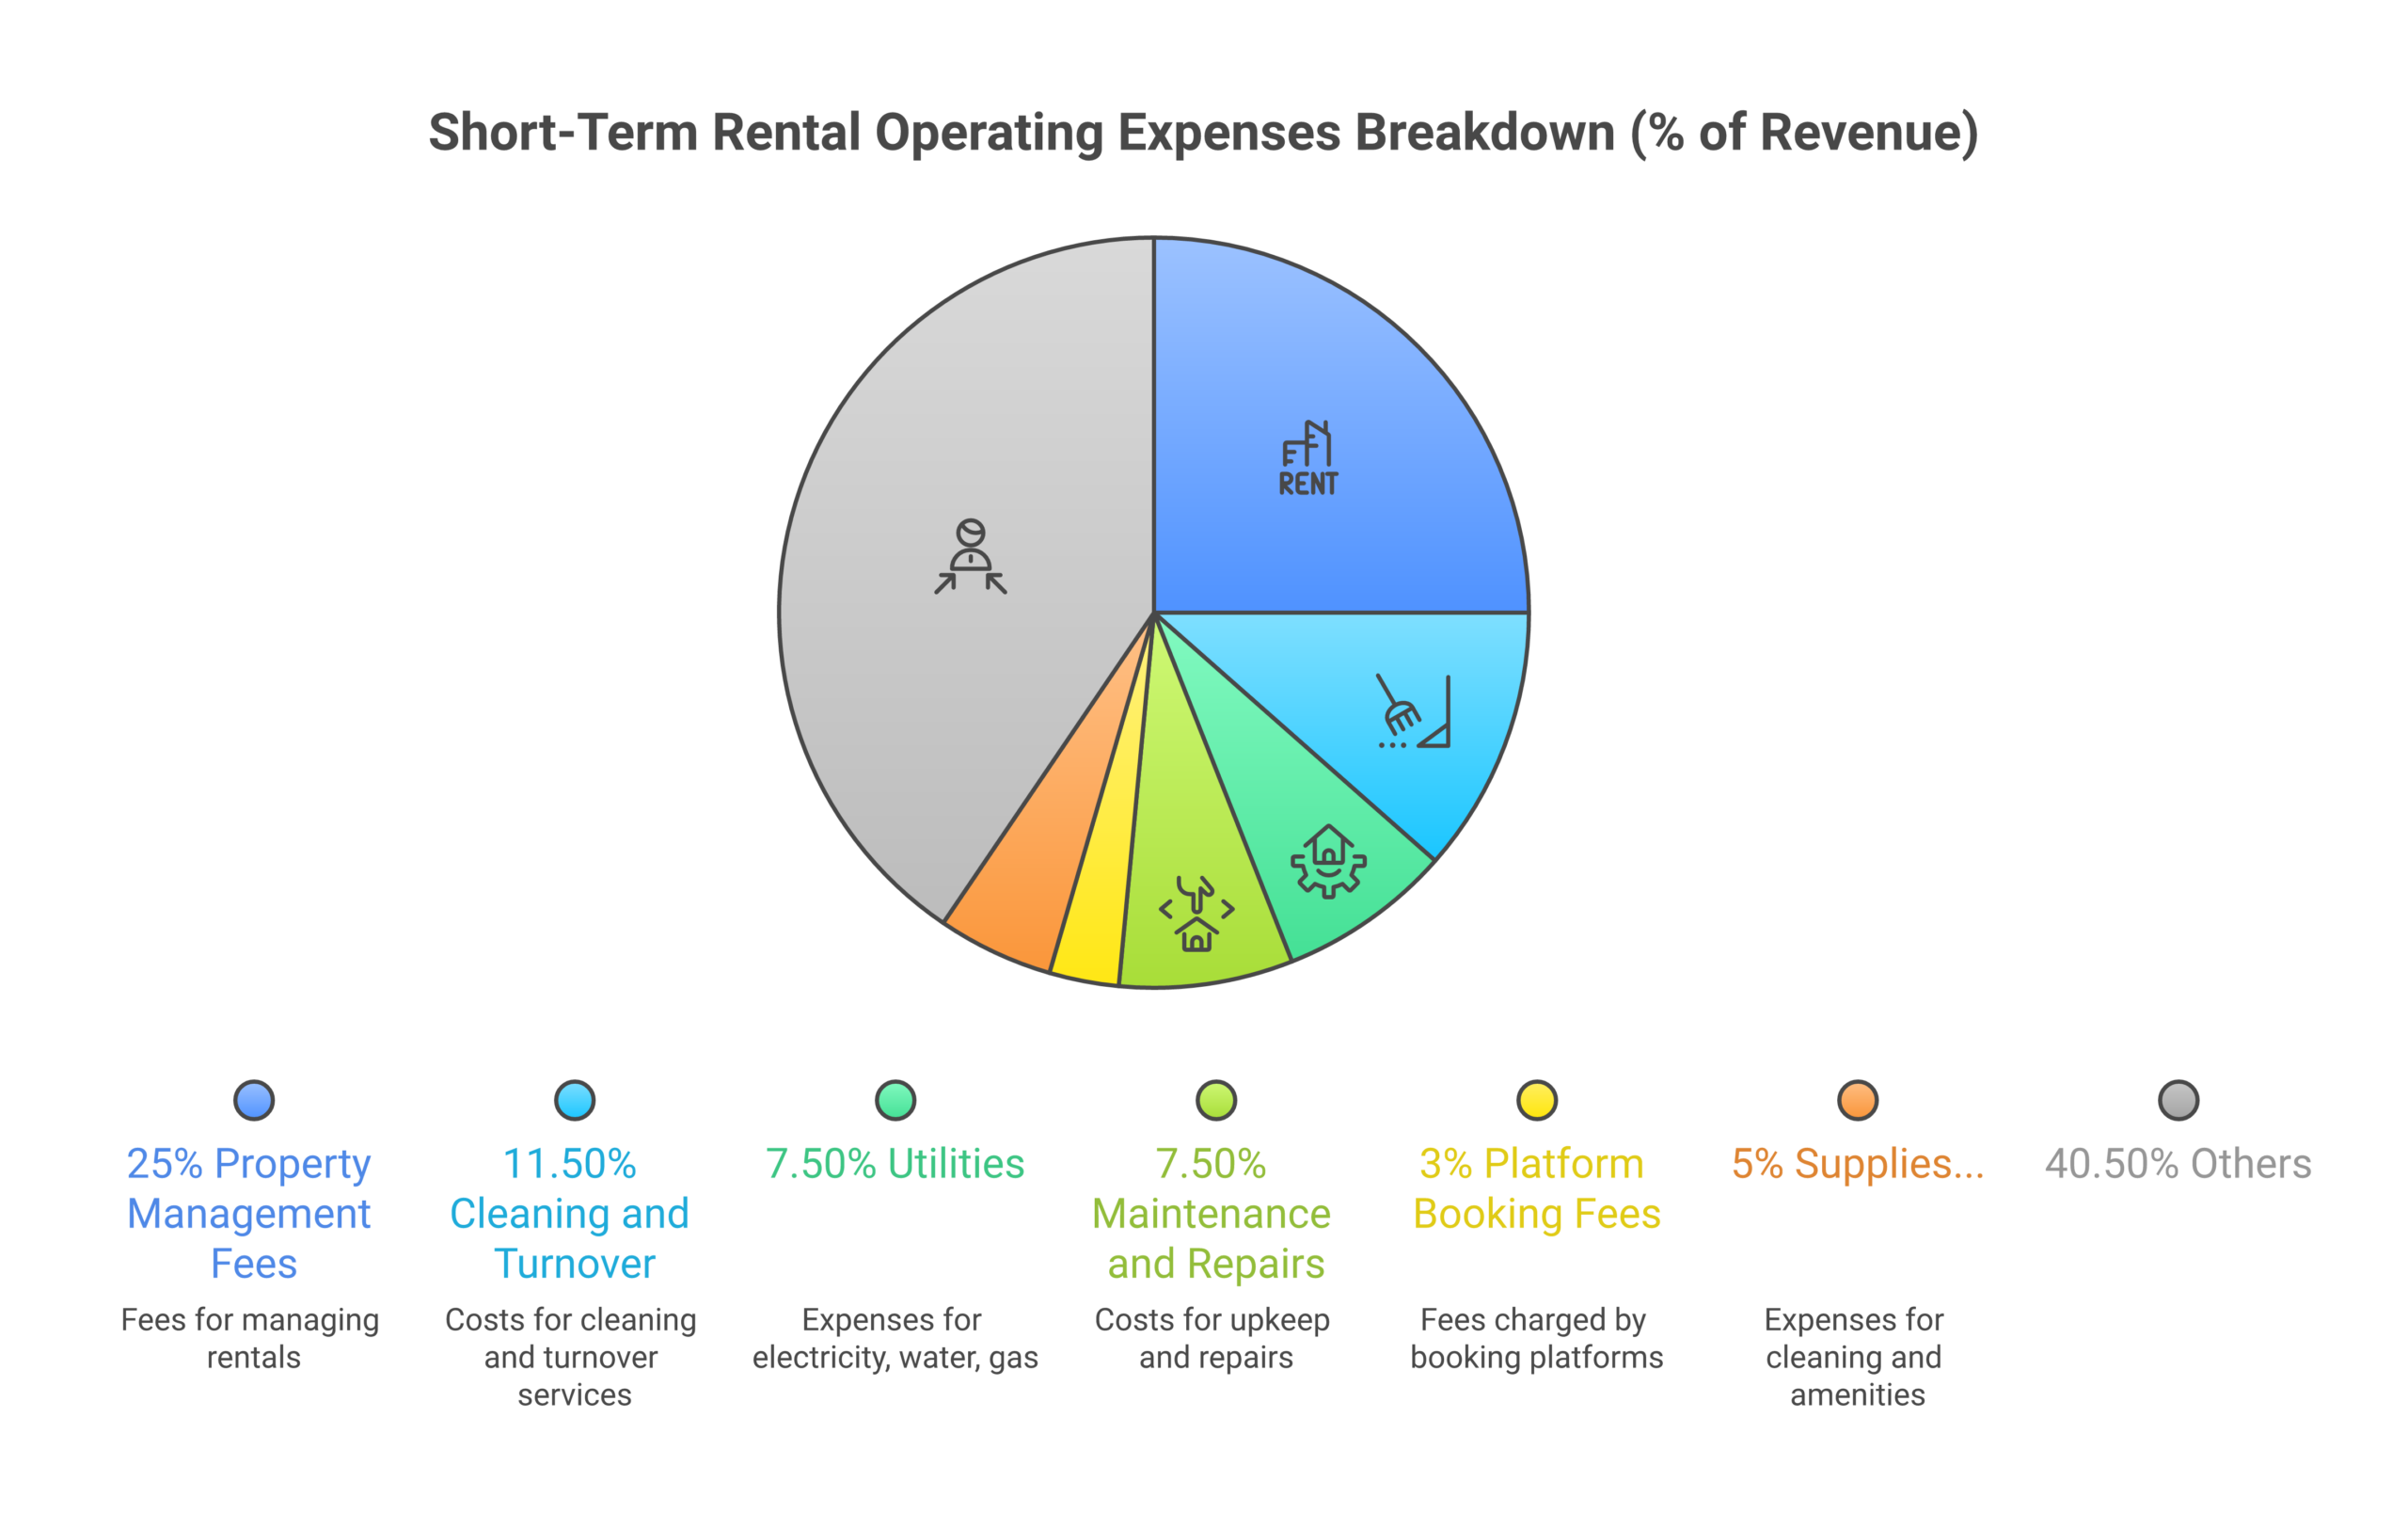
Common Operating Expenses for STRs
Operating expenses for vacation rentals typically run higher than long-term rentals. Property management fees alone can range from 20% to 30% of gross income for professionally managed STRs, according to vacation rental industry benchmarks. Here’s what to include:
| Expense Category | Typical Range (% of Revenue) |
|---|---|
| Property management fees | 20-30% |
| Platform booking fees (Airbnb host fee) | 3% |
| Cleaning and turnover costs | 8-15% |
| Utilities (electric, water, gas, internet, cable) | 5-10% |
| Property taxes | Varies by location |
| Insurance (STR-specific policy) | 1-3% |
| Maintenance and repairs | 5-10% |
| Supplies (toiletries, linens, consumables) | 2-4% |
| Landscaping and HOA fees | Varies |
Do not include mortgage payments, capital expenditures (roof replacement, HVAC install), or personal use costs in your NOI calculation. Mortgage payments are financing costs, not operating costs, and including them would skew your valuation.
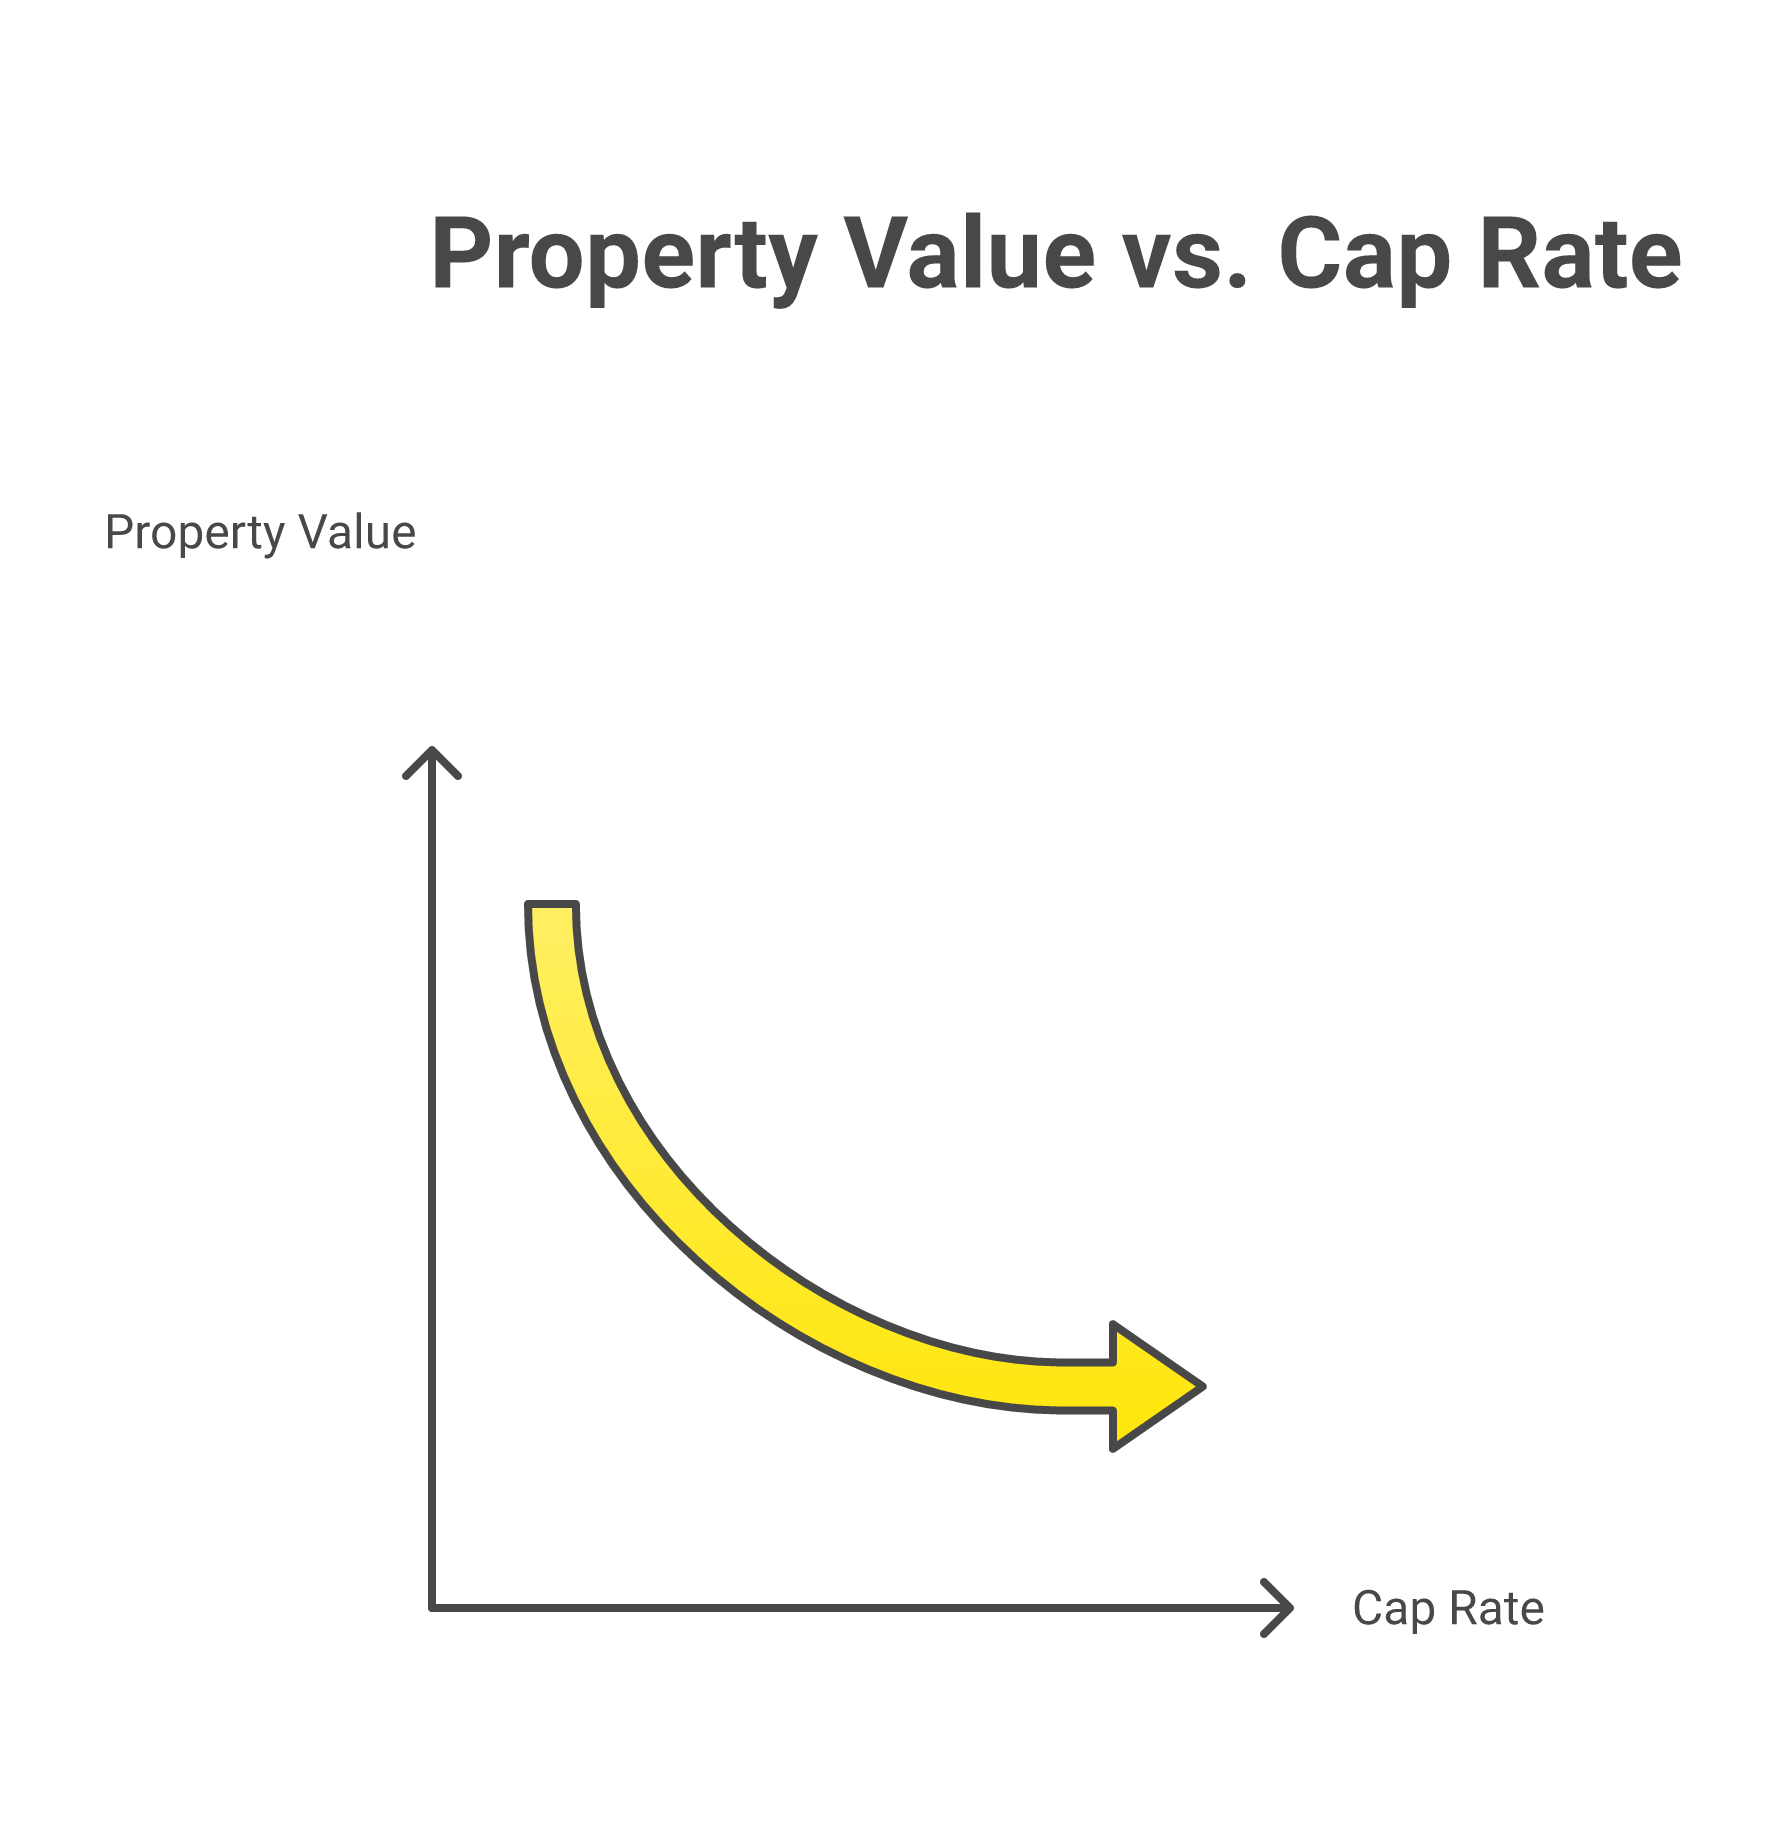
Cap Rate: Converting NOI into Property Value
The capitalization rate (cap rate) converts your NOI into a property value estimate. The formula works two ways:
Property Value = NOI / Cap Rate
Cap Rate = NOI / Property Value
For vacation rentals, cap rates typically fall between 5% and 10%, depending on the market, property type, and risk level. Here’s how different cap rates affect a property with $60,000 in annual NOI:
| Cap Rate | Implied Property Value | Market Type |
|---|---|---|
| 5% | $1,200,000 | Low-risk, high-demand coastal or urban |
| 6% | $1,000,000 | Stable tourism market |
| 8% | $750,000 | Balanced mid-tier destination |
| 10% | $600,000 | Higher-risk or seasonal-only market |
A higher cap rate means higher perceived risk and a lower property value relative to income. A lower cap rate signals stability and premium pricing. According to Vacasa and AirDNA market data, popular ski destinations often see cap rates of 8% to 12%, while year-round coastal markets tend toward 5% to 7%.
The biggest mistake with cap rates: using the wrong comparables. Compare your STR’s cap rate only against other vacation rentals in the same market, not against long-term rental cap rates or commercial real estate averages.
Gross Rental Yield vs. Net Rental Yield
Gross rental yield is the quick-and-dirty version of return analysis. It divides annual rental income by purchase price:
Gross Rental Yield = (Annual Rental Income / Property Price) x 100
Useful for initial screening, but it ignores every expense. A property with 12% gross yield and 45% expense ratio actually nets 6.6%. I tell my students to always calculate net rental yield instead:
Net Rental Yield = ((Annual Income – Annual Expenses) / Property Price) x 100
Net yield gives you the actual return before financing. For rental arbitrage, where you lease rather than buy, replace “property price” with your total annual lease cost plus setup expenses to calculate your arbitrage yield.
Cash-on-Cash Return: What Your Actual Investment Earns
Cash-on-cash return measures how much cash you earn relative to the cash you put in. This is the metric that matters most for financed purchases:
Cash-on-Cash Return = Annual Pre-Tax Cash Flow / Total Cash Invested
Total cash invested includes your down payment, closing costs, furnishing, and any initial renovation. Annual pre-tax cash flow is your NOI minus annual debt service (mortgage payments).
Example: You put $100,000 total into a property (down payment plus setup). The property generates $72,000 in gross revenue, $42,000 in operating expenses (NOI = $30,000), and your annual mortgage is $18,000. Your pre-tax cash flow is $12,000, giving you a 12% cash-on-cash return.
For rental arbitrage deals, cash-on-cash returns can be significantly higher because your upfront investment is typically $5,000 to $15,000 in furnishing and setup rather than a six-figure down payment.
Revenue Per Available Night (RevPAN) and Average Daily Rate (ADR)
These two metrics work together to show pricing effectiveness:
- Average Daily Rate (ADR) = Total Revenue / Number of Booked Nights
- RevPAN = Total Revenue / Total Available Nights
ADR tells you what guests pay on nights they book. RevPAN tells you what you actually earn per night across the whole year, including empty nights. A property with a $300 ADR and 60% occupancy has a RevPAN of $180. A competing property with $200 ADR and 85% occupancy has a RevPAN of $170.
The first property generates more per available night despite lower occupancy, which matters for valuation. When comparing properties, RevPAN is more useful than occupancy rate alone because it accounts for both pricing power and demand.
Use dynamic pricing tools like PriceLabs or Beyond to optimize both metrics simultaneously. Proper pricing can increase RevPAN by 15% to 25% without changing anything about the property itself.
Occupancy Rate and Break-Even Analysis
Occupancy rate matters, but it’s not the whole story. A property at 90% occupancy with razor-thin margins is less valuable than one at 65% occupancy with strong nightly rates.
Your break-even occupancy rate tells you the minimum nights you need booked per month to cover all costs:
Break-Even Occupancy = (Monthly Fixed Costs + Monthly Variable Costs) / Average Nightly Rate
For rental arbitrage, your fixed costs include monthly lease payment, insurance, and subscriptions. Variable costs include cleaning, supplies, and platform fees per booking. If your monthly fixed costs are $3,000, variable costs average $50 per night, and your ADR is $200, you need to book 20 nights per month to break even ($3,000 / ($200 – $50) = 20 nights).
Any night beyond that 20-night threshold is profit. When evaluating a property, I look for a break-even occupancy under 50%. That gives you enough cushion for seasonal dips without bleeding cash during slow months.
Key Factors That Drive Vacation Rental Property Value
Numbers tell part of the story. These qualitative factors determine whether those numbers hold up or fall apart over time:
Location and Market Demand
Properties near popular attractions, beaches, ski resorts, or entertainment districts command higher ADRs and occupancy rates. But “location” also means micro-factors: walkability, views, parking availability, and noise levels. A cabin 10 minutes from the ski lift is worth less than one with ski-in/ski-out access, even at the same price point.
Check market demand trends over at least 24 months before buying. Markets that depend on a single event or attraction are riskier than destinations with year-round draw.
Regulatory Environment
Short-term rental regulations can destroy property value overnight. Cities like New York, San Francisco, and Barcelona have enacted strict STR limits that wiped out rental income for thousands of hosts. Before valuing any property, research:
- Current local STR permit requirements
- Zoning restrictions for short-term rentals
- Pending legislation that could restrict STR activity
- HOA or condo association rules on rentals
A property with $80,000 in annual rental income is worth far less if the city council is actively debating a 90-day annual cap on STR bookings. Factor regulatory risk into your valuation by discounting projected income based on the probability and severity of potential restrictions.
Property Condition and Guest Experience
Review scores directly impact bookings and ADR. Properties with an average rating above 4.8 on Airbnb earn measurably higher nightly rates than those below 4.5. Deferred maintenance, outdated decor, and missing amenities (fast WiFi, smart locks, hot tubs) all reduce a property’s income potential and, by extension, its value.
When evaluating a purchase, budget 5% to 10% of the property price for upgrades that boost the guest experience and justify higher pricing.
Seasonality and Revenue Consistency
A vacation rental that earns 70% of its annual revenue in three months carries more risk than one that generates steady income year-round. Calculate a seasonality index by dividing each month’s revenue by total annual revenue. High-seasonality properties need larger cash reserves and more aggressive off-season marketing.
Markets with year-round appeal, like Austin, Nashville, and Scottsdale, often command lower cap rates (higher valuations) specifically because their revenue is more predictable. AirDNA’s 2025 year-round market rankings highlight cities like Nashville, Austin, and Scottsdale as having the strongest 12-month demand consistency.
Tools and Data Sources for Accurate Valuation
You need real data, not guesswork. These tools provide the market intelligence to back up your valuation:
- AirDNA: The industry standard for STR market data. Provides revenue estimates, occupancy rates, ADR, and comp analysis by address. Their MarketMinder tool shows historical trends over multiple years
- PriceLabs: Dynamic pricing and market analytics. Their neighborhood data reports help identify micro-market trends
- Mashvisor: Investment property analysis with traditional vs. STR return comparisons
- Your local MLS: Recent comparable sales data for the purchase price side of the equation
- Airbnb/Vrbo search: Manual comp analysis by searching active listings in your target area, checking their calendars, and estimating occupancy
The 10XBNB Deal Analyzer Spreadsheet combines these data inputs into a single ROI model that calculates NOI, cap rate, cash-on-cash return, and break-even occupancy automatically.
Common Valuation Mistakes to Avoid
After reviewing hundreds of student deal analyses, these are the errors I see most often:
- Using Zillow/Redfin estimates as property value. These algorithms don’t account for STR income potential. A home estimated at $400,000 by Zillow might be worth $550,000 as a performing vacation rental
- Projecting revenue based on peak season only. Take the annual average, not the best month times twelve. Seasonality will eat your returns if you don’t plan for it
- Underestimating operating expenses. First-time investors routinely forget platform fees, linen replacement, guest supplies, and maintenance reserves. Budget 40% to 55% of gross revenue for total operating costs
- Ignoring regulatory risk. A property in a market moving toward STR restrictions is declining in value, regardless of current income
- Skipping the comp analysis. If you can’t find at least 3 to 5 comparable STRs performing at the revenue level you’re projecting, your estimate is optimistic
- Confusing gross yield with actual returns. Gross yield is a screening tool. Net yield and cash-on-cash return are what you actually take home
Tax Benefits That Affect Vacation Rental Value
Here’s something most new investors miss: taxes can make or break your actual return. I’ve seen students add $15,000 to $20,000 in annual take-home simply by working with the right accountant.
The big four tax benefits for STR owners:
Depreciation is the silent wealth builder. The IRS lets you write off residential rental property over 27.5 years. So a $500,000 property generates roughly $18,000 per year in paper losses you can deduct against rental income, even while the property goes up in market value.
Operating expense deductions cover everything on that expense table above: cleaning, supplies, management fees, repairs, insurance, utilities. All deductible.
Mortgage interest on your investment property loan? Also deductible. For financed purchases, this is a major offset in years one through five when interest makes up the bulk of your payment.
1031 Exchanges let you sell one investment property and roll the proceeds into another without paying capital gains tax. I know investors who have done three or four 1031 exchanges over a decade and deferred hundreds of thousands in taxes.
One strong recommendation: work with a CPA who specializes in short-term rentals, not a generalist. STR tax strategy is its own world, and the savings easily cover the higher accounting fees. And set up an LLC before you start operating. Restructuring ownership later is expensive and messy.
Related guides: co-host training program, guide to getting started with Airbnb, best Airbnb courses in 2026, 10XBNB mentorship program.
Frequently Asked Questions
What is a good cap rate for a vacation rental property?
Anywhere from 6% to 10% is solid for most STR markets. Beachfront condos in Maui or downtown Nashville might sit at 5% to 7% because demand is consistent and risk is lower. A cabin in a seasonal mountain town could hit 8% to 12%. The key is comparing against other STRs in your specific area, not some national average that blends completely different markets together.
How do I value a vacation rental property I haven’t bought yet?
Pull revenue estimates from AirDNA for 3 to 5 comparable listings near the property. Subtract estimated operating expenses (I use 40% to 55% of gross income as the range depending on whether you self-manage or hire a PM company). That gives you projected NOI. Divide by the local STR cap rate and compare against the asking price. If the income-based value is below the asking price, the deal doesn’t pencil.
Is vacation rental property value the same as traditional home value?
Not even close. Traditional value leans on comparable sales. Vacation rental value is about income. I’ve seen the same house appraised at $400,000 by a residential appraiser and valued at $600,000+ by an investor looking at the rental income it produces. The reverse happens too, if the city bans STRs tomorrow, that “valuable” vacation rental is suddenly just a house.
How often should I revalue my vacation rental?
Once a year at minimum, using actual revenue and expense data from the prior 12 months. If you’re in a market where regulations are shifting or new supply is flooding in, do it quarterly. Waiting two or three years between valuations is how people get blindsided by declining returns.
What is the difference between NOI and cash flow?
NOI is what the property earns before you pay the bank. Cash flow is what lands in your account after the mortgage payment clears. A property can have strong NOI ($40,000) but weak cash flow ($5,000) if the debt service is high. You use NOI for property valuation. You use cash flow to decide if you can actually afford to hold the property month to month.
Start Making Data-Driven Investment Decisions
Valuing a vacation rental property accurately requires real data, honest expense accounting, and the right formulas applied to the right comparables. Every metric in this guide, from NOI and cap rate to cash-on-cash return and break-even occupancy, gives you a different lens on the same question: is this property worth the price?
At 10XBNB, we teach students to run these numbers on every deal before signing a lease or making an offer. The students who follow the framework avoid the costly mistakes that sink first-time investors. If you want hands-on guidance applying these valuation methods to real deals in your target market, book a free strategy call with our team to see if the 10XBNB program is the right fit for your goals.